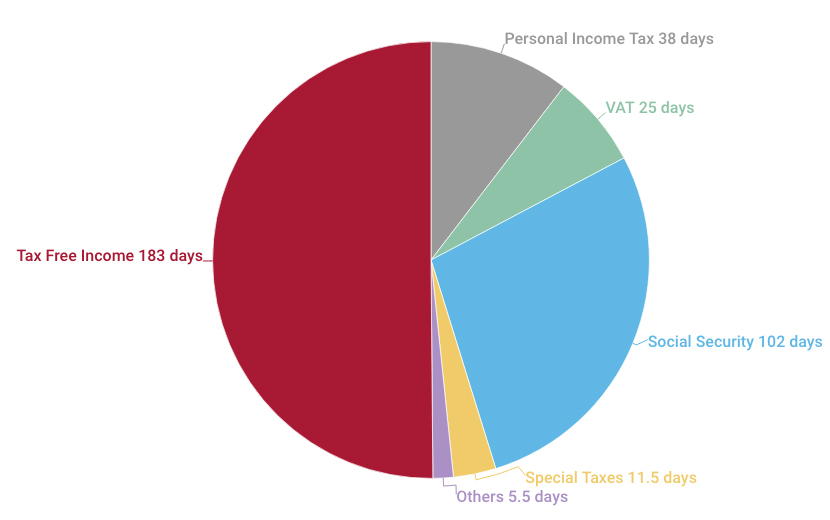
On July 1, it is Tax Freedom Day in Spain. In other words, Spanish workers need 182 days to fulfill their tax obligations. The Tax Freedom Day is the date on which citizens have generated enough income to pay all taxes. From then on they start working for themselves.
The Tax Freedom Day translates the tax effort into the number of days that workers need to pay their taxes (direct and indirect) and Social Security contributions. A Spanish worker with an average gross annual salary of 24,400 euros would spend 102 days to pay Social Security contributions, 38 to pay personal income tax, 25 VAT, 11.5 to special taxes and 5.5 to other taxes. In total, he would spend 182 days of his work (15,775 euros) to fund the State. How is it possible to pay more than 15,000 euros in taxes with a gross salary of only 24,000? Because, in reality, the labour cost of this worker is 31,696 euros.
As of May of this year, Social Security contributions —made by the employer— also appears on the workers’ payroll receipt. Until now it was not reflected. This is an important change, although insufficient because when negotiating the terms of a contract, we still talk about the gross salary and not the labour cost for the company. Therefore, most workers are unaware that the company contributes to the Social Security the equivalent of 84 days of work; 7,296 euros above the gross salary. This means that the real value of the worker —or the labour cost for the company— actually amounts to 31,696 euros.
For the first time in the last five years, the Tax Freedom Day is moves backwards. The reform undertaken by the Government last year and the reduction of some regional taxes have made the tax freedom day to take place on July 1, two days before 2014.
Graph 1. What does your working day translates into?
Tax effort and income level
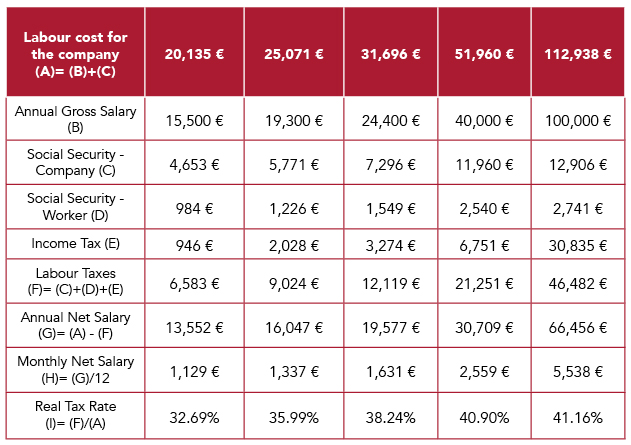
To analyse the tax effort based on income, five scenarios have been taken into account: A person who earns 15,500 euros (the most common salary in Spain), another who receives 19,300 euros (the median salary, which divides the number of workers into two equal parts, those with a higher salary and those with a lower salary), an average income of 24,400 euros, a salary of 40,000 euros, and another of 100,000 euros.
Table 1. Labour taxation in Spain (2015)
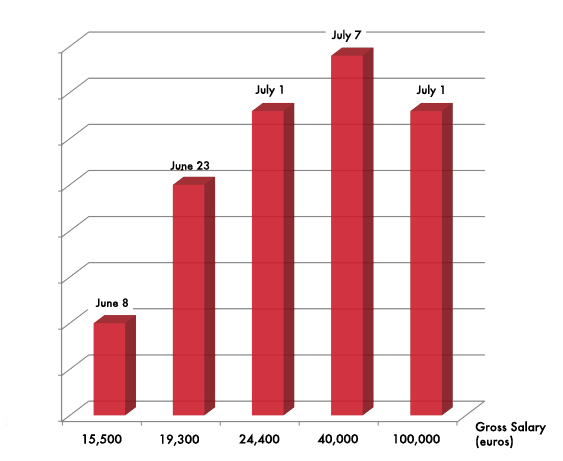
Each of these individuals goes through different personal situations and consumption habits. As can be seen in the graph, the tax effort grows with the gross salary: from June 8 for an income of 15,500 euros to July 7 for an income of 40,000 euros; 29 days apart between worker who makes 1,000 euros a month and a wealthy worker. Moreover, from a certain level of income, as Social Security contributions have a maximum limit, the tax effort of workers is reduced by six days, from July 7 —in the case of a person who earns 40,000 euros— to July 1 for a person with a gross salary of 100,000 euros. The explanation of this behaviour is detailed in the following section on labour taxation.
Salaries in Spain are triple taxed with Income Tax, Social Security paid by the worker and Social Security paid by the employer. Social Security consists of a tax that is not included in the worker’s gross salary, even if it appears on the payroll. The Social Security contributions made by the employer multiply by five times the withholdings that are applied directly to the payroll of the average worker and become a part still hidden for the worker. However, Social Security contributions can be considered as one more tax, since they all go to a common fund from which the pensions of today’s retirees are paid, so that they do not represent real insurance for the current taxpayer.
As it is known, Social Security contributions have a single tax rate in Spain. It is not a progressive tax like personal income tax. In addition, no deductions are made depending on the level of income. Therefore, even for the lowest income, the rate that is applied is the maximum, of 36.25 percent: 29.9 percent paid by the company and 6.35 percent by the employee.
Graph 2. Tax Freedom Day according to income level (2015)
However, the contributions have a maximum limit: gross income that exceeds 3,606 euros per month (43,272 euros per year) only pay up to this level, so that no taxpayer can contribute more than 15,686 euros per year to Social Security. As a result, higher incomes benefit from this system. At the same time, the existence of this roof poses another problem: for the employer, without a doubt, it is cheaper to raise the salary to those workers who earn more than to the lowest salaries, thus incentivising poor workers and sharpening, increasingly, the possible differences between social classes.
To analyse the taxation of labour, the previous five scenarios have been taken into account: a person who earns 15,500 euros (the most common salary), another who earns 19,300 euros (the median salary), an average income of 24,400 euros, a salary of 40,000 euros and another income of 100,000 euros. For each of these cases, the corresponding personal income tax, social security contributions paid by the company and the one faced by workers have been calculated. The labour cost for the company or the total gross salary formed by the worker’s annual gross salary plus the Social Security contributions paid by the company has also been calculated, as detailed in the table.
Once the total income tax, formed by the personal income tax added to the total Social Security contributions, has been calculated, the real tax rate (tax wedge) applied to each of the five cases has been calculated. The results are reflected in graph 3.
The real tax rate for a monthly salary of 1,000 euros is 32.69 percent; 38.24 percent for a net salary of 1,600 euros, and 41.16 percent for one of 5,500 euros. These results reveal that the progressiveness in labour taxation is reduced to only eight percentage points. In this way, it is of little use that there are Autonomous Communities such as Extremadura or Navarra that have up to nine or eleven tranches of income or that the tax rates range from 13 percent (Navarra) to 49 percent in some Autonomous Communities if in the end this difference of 36 percent is reduced to a real differential of 8 points.
Graph 3. Real tax rate according to income level

For this same reason, different OECD studies, including Taxing Wages 2015, reveal that, beyond a certain level of income, the Spanish tax system is regressive. That is, comparatively, taxpayers pay considerably higher taxes than the lower and middle income high incomes.
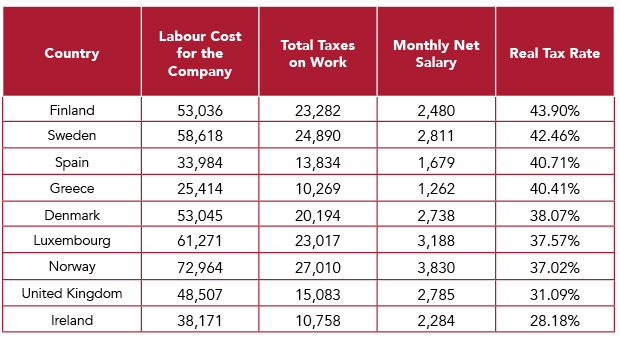
If we analyse the situation of the Spanish worker in the context of the European Union, we can see how the tax rate applied here (40.7 percent) on a net income of 1,679 euros is similar to that applied in countries like Sweden or Finland. However, a crucial difference should be noted: the average salary of these countries reflected in the table is 70 percent higher than the income of a Spanish taxpayer.
But we also have the example of the United Kingdom, which with a labour cost similar to that of the Spanish employee (only 11 percent higher), its workers are paying less taxes than in Spain (10 percent less), making their net salary much higher than ours (30 percent more). Denmark, Luxembourg, Norway or Ireland are other countries that, with much higher income levels than the Spanish, tax income at much lower tax rates than we do: between 28 percent and 38 percent, respectively.
Once again, Spanish taxation is evidenced by taxing average and low incomes well above the corresponding level. We Spaniards are not completely poor, but the Treasury keeps a greater percentage of our money. This bite hurts more because we have a lower income than the rest of the EU countries. But higher incomes are not saved either. According to KPMG, Spain is one of the countries of the European Union in which the maximum rate of income tax is higher, only exceeded by that of Denmark (55.41 percent), Finland (52.35 percent), Netherlands (52 percent), Austria (50 percent) and Belgium (50 percent). However, the European average (37.78 percent) is 11 points below the tax rate applied in Spain.
The maximum personal income tax rate applicable at this time in Spain is 49 percent, although not all Autonomous Communities have chosen to raise it to this level. Andalusia, Asturias and Catalonia are the three Autonomous Communities where the maximum rate (regional and state) reaches 49 percent. The three Basque provinces also increased the personal income tax to 49 percent in 2014.
Taxation in OECD countries
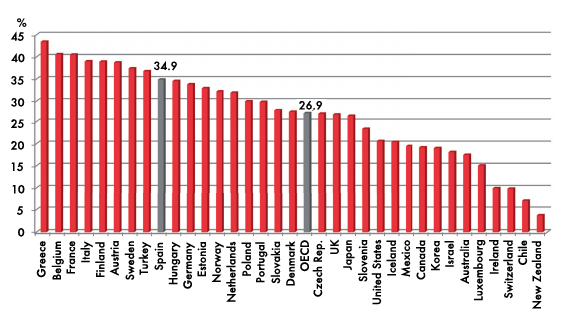
According to the latest OECD report, Taxing Wages 2015, the tax wedge on salaries in Spain is the thirteenth highest of the 34 countries analysed. Therefore, for every 1,000 euros charged to the Spanish taxpayer, 407 euros are taken by the State. This way, the Spanish taxpayer pays up to five percent more as labour taxes than the OECD average, located at 36 percent.
Table 2. Labour taxation in Europe (2015)

In addition, Spain stands out as one of the countries with the highest progressiveness in the first three levels of income and reduced progressiveness for higher incomes. The little progressiveness that exists for high incomes is mainly due to the existing ceilings in Social Security contributions.
The tax system and families
The study also analyses the tax pressure that couples with children endure in each of the countries based on the level of income. According to this study, after the latest increases in tax rates in Spain, couples with children and a single salary withstand a pressure well above the OECD average (8.4 percent) and that of Germany, Norway or Denmark. In addition, in countries such as Germany, families with children receive about 180 euros per month for each child as a family allowance and benefit from a reduction in the taxable amount for dependent children of over 7,000 euros per year.
Graph 5. Tax wedge: couple with children and one salary
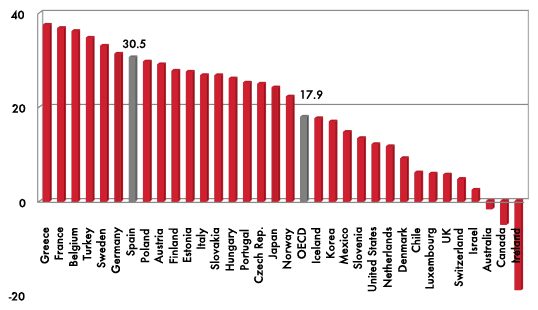
Over the last four years, this group of taxpayers (with dependent children) has been the most punished for the tax increase in our country. In the case of a single-parent family with children and an income that does not reach 70 percent of the average salary, the tax pressure doubles the average of developed countries: 30.5 percent in Spain versus 17.9 percent, the average of OECD countries.
With the latest reform, we Spaniards will be slightly relieved, but we will have to wait until 2016 to ensure that the Government keeps its promises. Even so, we still like to penalize work and have children, the pillars of the future. Do not forget that, given the design of the pension system in Spain, it is these families that will support it in the future. They cannot be «taxed» and pretend to save money to offer a good education to their children, a sine qua non condition for high salaries capable of covering the huge expenditure of pensions.
The report also analyses the evolution of tax pressure in the last fourteen years. Between 2000 and 2014, Spain shows a different trend since tax pressure grows well above the OECD average, regardless of income level or family situation.
Apart from the Income Tax, Social Security contributions also contribute to making the tax effort of Spanish workers so high. Although all European countries have a Social Security system, the benefits offered are not always the same. The most significant case is that of healthcare system, since in some countries (such as Spain) it is financed through taxes (Beveridge model) or through social insurance (Bismark model). Therefore, when comparing Social Security contributions, the benefits of each system must also be taken into account.
Graph 6. Tax wedge: single parent family with children
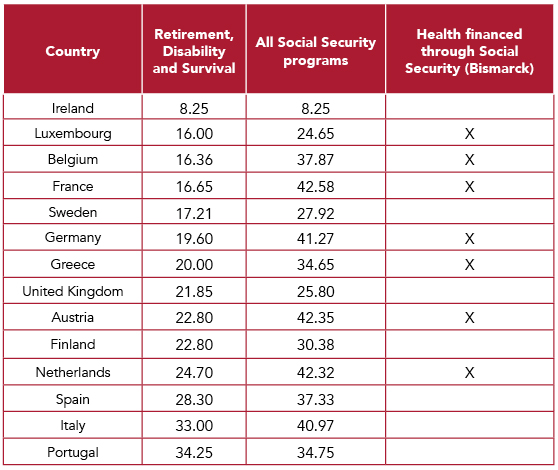
If we only take into consideration the type of contribution that covers retirement, disability and survival, Spanish workers and their companies are the ones contributing the most (28.3 percent), only behind Italy (33 percent) and Portugal ( 34.35 percent). By contrast, in Germany, France, Sweden and Belgium, the prices range from 16 percent to 20 percent, between 8 and 12 points below Spanish contributions. However, when considering the set of contributions for all Social Security programs, Spain moves from third to seventh position. Thus, in our country the contributions reach 37.33 percent of the gross salary, while in Germany, France, Austria and the Netherlands, contributions are set between 41 percent and 42 percent. However, this difference is due to the way the healthcare system is funded. In Spain, healthcare is financed through taxes, while in the other countries mentioned it is mainly financed through Social Security contributions.
There is a false belief that healthcare is also funded through Social Security. However, Social Security first entered into crisis in 1978, the year in which it stopped funding unemployment benefits and shortly thereafter health care. Since the approval of the General State Budgets of 1999, the financing of the National Health System (SNS) is completely separated from Social Security and is now funded through direct and indirect taxes. The system is funded, to a greater or lesser extent, by all its potential users, since VAT and special taxes are paid by all citizens, regardless of their legal or employment status. Therefore, the messages that associate the right to health with Social Security contributions try to encourage social insolvency, encouraging people to take advantage of the system.
Table 3. Types of contributions for Social Security programs
Tax Freedom Day by Autonomous Community
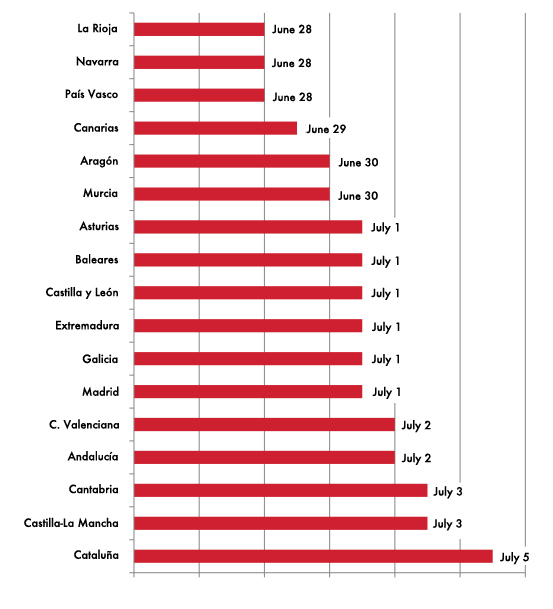
Although the Spanish average tax freedom day is July 1, the tax effort varies from one Autonomous Community to another. Currently, there is an arc of up to 7 days between La Rioja, the Basque Country and Navarra —the Autonomous Communities with the least tax effort— and Catalonia —the one with the highest tax effort.
For an average citizen, living in Catalonia would cost 7 more days of work per year and 594 extra euros compared to a Navarra resident. The reason for this difference is due to the fact that the Income Tax and the Property Tax of Barcelona are well above the average. In addition, the Circulation Tax and the Retail Hydrocarbon Sales Tax are also higher. By contrast, in Navarra, the Basque Country and La Rioja, the tax freedom day is celebrated on June 28, 3 days before the national average date. This difference is largely due to municipal taxes such as IBI or Circulation Tax. Taxpayers are also benefited by the lack of regional tax on the Retail Sale of Hydrocarbons. Finally, also, the Income Tax is more reduced in these three Autonomous Communities. However, in the case of the Basque Country, it is precisely this tax that causes this difference with the national average. In this way, the taxpayers of these three Communities save around 200 euros a year in taxes.
With the aim of creating a guide thanks to which the citizen can know in which Autonomous Community it is more advantageous to work, the national average income has been used as a reference to calculate the Tax Freedom Day of each Autonomous Community, instead of the average salary of each region. This should also serve to stimulate tax competition between Autonomous Communities, so that they offer a more favorable treatment to the taxpayer —even in those taxes that have less «electoral cost».
One of the reasons for calculating the existing regional differences for the same salary level is to avoid the belief that in the richest Autonomous Communities —where taxpayers pay more because they make more— higher tax rates apply. Thus, the comparison is given on equal terms. To calculate the Tax Freedom Day in 2015, the same salary was used as in 2014, 2013 and 2012 so that the results can be comparable.
Graph 7. Tax Freedom Day by Autonomous Community (2015)
Taxation in 2015
2015 has brought several tax changes both at state and regional and local levels. The state tax reform has translated for the average worker —gross salary of 24,400 euros— in a reduction of 230 euros per year in income tax. However, it will be necessary to wait until 2016 to ensure that the Government keeps its promises, implementing the second part of the reform. In addition, although the number of sections in the tax has been reduced from 7, in 2014, to 5, in 2015, there is still one more than in 2010, when there were only 4 sections.
In 2015, the regional section of the income tax has also been modified in all Autonomous Communities, except in Andalusia, Catalonia and Galicia. Nor was the tax reformed in the three provinces of the Basque Country. In the Autonomous Communities that did modify the personal income tax, the taxpayers of Castilla-la Mancha and Cantabria have benefited the most, saving more than 175 euros per year —apart from the 230 extra euros of the state reform. Also, employees in Aragón, Asturias, Canarias, Castilla y León and Murcia take home between 100 and 150 more euros per year. And finally, between 60 and 100 euros of savings go to the taxpayers of Extremadura, Baleares, La Rioja and Madrid. In the case of Navarra, the reform has meant a total saving of 178 euros, even below the benefits generated by the reform of the state tax.
The Property Tax has remained unchanged in most of the Autonomous Communities. La Rioja, however, has applied this year a bonus in the 50 percent quota, getting closer to the position of the Community of Madrid where the tax has a 100 percent bonus. Also Navarra, following the previous edition of this report (Tax Freedom Day 2014), has been forced to reduce tax rates and increase exempt minimums to bring them closer to the national average.
Regarding the Tax on Retail Sales of Hydrocarbons, Cantabria eliminated it, Castillo y León reduced it from 4.8 cents to 1.6 cents per liter and Extremadura also slightly decreased it, from 4.8 to 3.84 cents per liter . The remaining Autonomous Communities have kept it unchanged.
As far as municipal tax policy is concerned, it can be observed that public opinion has been able to influence the reduction of local taxes that are too high. Instead, mayors who have not been pressured by their voters have chosen to raise and not change rates. In 2015, San Sebastián and Madrid slightly reduced the tax. However, San Sebastián, along with Vitoria and Bilbao, is still the most expensive city to have a car. They are closely followed by Oviedo (Asturias), Santander (Cantabria), Valladolid (Castilla y León), Palma de Mallorca (Baleares) and Madrid.
Another local tax, of the utmost importance for municipalities because of their collection power is the Property Tax (IBI, in Spanish). In 2015, some consistories have chosen to raise it slightly, either through the cadastral value, either through the rate, or by the combination of both factors: Santander (Cantabria), Mérida (Extremadura), Toledo (Castilla-La Mancha) . Instead, the municipalities of Valencia, Santa Cruz de Tenerife, Palma de Mallorca, Murcia and Oviedo (Asturias) have decided to lower the IBI moderately.
Principles of a good tax system
Albert Einstein said that the most difficult thing to understand in the world is the income tax. No wonder if we consider the tax set up of some countries. Already in the 18th century Adam Smith, in The Wealth of Nations, enumerated the general principles for a good tax system.
First, proportionality: each person should pay a fixed, non-progressive percentage of their income, complying with tax equity. In addition, taxes should be «foreseeable», not arbitrarily designed, avoiding exemptions and deductions established depending on the source of income or other factors. The system should not create incentives to avoid taxes (e.g. Depardieu case) and should be simple to minimise the cost of collection. According to the Paying Taxes 2015 report, in Spain, a company allocates 167 hours a year to pay taxes: approximately one month of work to meet the tax requirements. The study reveals that reducing the complexity of the tax system would raise, on average, GDP by a quarter of a point. Switzerland and Luxembourg are the European countries where less time is spent complying with tax obligations: 63 hours and 55 hours respectively, three times less than in Spain.
A good system would also be characterised by a tax pressure that does not discourage work and investment. Furthermore, it should not encourage certain groups to try to obtain benefits from the hand of the rulers. The US Tax Foundation also establishes a guide about the characteristics that any tax would have to meet.
The Social Security contributions paid by the employer, not included in the gross salary, are the best example of tax opacity. The income tax in Spain, with up to 11 tranches, entails tax rates ranging from 13 percent to 49 percent. To this we must add the regional and state deductions that make this tax the antonym of tax simplicity. Stability is another important feature to highlight, which means that fiscal policy should be consistent and maintained in the long term. In addition, the changes cannot be retroactive as has been the case in the case of the Property Tax. In fact, taxpayers must have security, a certain guarantee that the legislation in force in the signing of their contract will be maintained in the future.
The tax system should have broad tax bases so that tax rates could be moderated (see VAT) and, finally, that free trade should not be restricted.
Empirical studies link the lower progressiveness of labour taxes with higher levels of unemployment. Regressiveness makes it more profitable to raise the salary of those who enjoy high incomes and ask for a higher return, than to hire an unemployed person. The European Commission analyses in a study (Taxation Paper No. 56) the effect of the tax system on the labor market in Spain, Italy and Austria. At first glance, the high unemployment rate may seem to be caused by the economic cycle and a labor supply problem. However, the report reveals that, in Spain, labor taxes are excessive, especially Social Security contributions. In addition, these contributions are not only characterised by low progressiveness, but are strongly regressive: the more one makes, the less one contributes. Therefore, the report recommends reducing labour taxes and especially social security contributions to reduce unemployment and activate consumption.
Summary and conclusions
The tax burden borne by taxpayers in Spain varies depending on the level of income, consumption habits and the Autonomous Community in which they reside. Therefore, although a Spaniard works on average until July 1 to pay all his taxes, this date hides important differences from one Autonomous Community to another or from one level of income to another. For the calculation of the tax freedom day, instead of taking the average salary of each region, the national pattern has been used with the objective of creating a guide for the taxpayer so that one can find out in which Community one should reside in the hypothetical case that one was offered the same salary. At the same level of income, with similar personal circumstances and consumption habits, the differences from one place to another can mean up to 7 days of work. These are mainly due to the Property Tax (IBI), a municipal tax that varies greatly from one City Council to another. The same applies to the Circulation Tax, higher in cities such as San Sebastián, Bilbao, Vitoria, Oviedo, Santander, Valladolid and Palma de Mallorca.
To a lesser extent, Income Tax also influences the tax burden. Navarra and the Basque Country are the two Autonomous Communities that have always taken advantage of their tax regime to tax incomes below the national average. However, in recent years, Madrid, Castilla-La Mancha and Cantabria have also used the IRPF regional tranche to reduce the fiscal effort to medium and low income. In contrast, Asturias, Catalonia, and Andalusia have used the regional tax to punish higher incomes. In addition, Autonomous Communities have applied different family minimums or regional deductions that benefit both single-parent families with several dependent children and large families.
Another regional tax that has led to differences in the tax burden is the so-called ‘sanitary cent’. Aragon, La Rioja, Navarra, Cantabria and the Basque Country are the five regions that have distanced themselves most from the rest by not applying this regional surcharge to the sale of fuels.
The report also analyses the tax freedom day for different income levels. The results reveal that there are 29 days of difference between someone making 1,000 euros a month and a well-off worker. However, once a certain income threshold has been exceeded, the fiscal effort is reduced, first by Social Security contributions and then by the consumption tax.
The VAT is a tax that, despite having different reduced rates, makes the tax effort of those low incomes that dedicate all their income to consumption be greater than that of wealthy families, since the latter can allocate part of their income to savings, and therefore, the VAT is not applied to that part.
The analysis of the tax effort supported by workers of different regions, reveals that the Autonomous Communities enjoy sufficient tax tools to modify the burden borne by taxpayers through autonomous and municipal taxes. This way, tax competitiveness is encouraged and it is possible to analyse whether a lower/higher level of tax effort can be used to revive the economy and employment. It should not be forgotten that Autonomous Communities such as Navarra or the Basque Country, which historically have had a tax pressure on income below the Spanish average, have also enjoyed lower unemployment rates.
When analysing labour taxation, it has been shown how the average Spanish income is taxed at the same level as in Sweden or Finland, although the average salary of these countries is 70 percent higher. On the other hand, Denmark, Luxembourg, United Kingdom, Norway or Ireland are other countries that, with average income levels much higher than Spain, have much lower tax rates than ours: between 28 percent and 38 percent, respectively .
We have also observed how 60 percent of labour taxes are not included in the gross salary. These are the Social Security contributions paid by the company; money that represents an important expense and that influences the worker’s salary. In fact, in Spain, total Social Security contributions are between 8 and 12 percent higher than the contributions made in countries such as France, Germany, Sweden or Belgium. In addition, it is these same quotes that have a unique rate and a maximum cap that reduce progressiveness from the 36 percent that is stipulated in the personal income tax to a real difference of only 8 percent. Thus, the more complex the tax system is, the less it serves to achieve the objective for which it has been designed. Therefore, we must start by including in the gross salary the Social Security contributions by the company and merge them with the worker’s contributions to reflect the real tax burden. In addition, without a substantial reduction in contributions, between 8 and 12 percent, to get closer to the levels of Germany, France, Sweden or Belgium, any reform that fosters private savings will be bound to fail. Furthermore, to create employment and reduce youth unemployment it is essential to have a minimum exempt that does not pay Social Security contributions, similarly to the minimum exempt in the income tax.
On the other hand, indirect taxes such as the VAT or special taxes on alcohol, tobacco, gasoline, are also the ones that most affect taxpayers with low incomes. Although poor people consume less alcohol, tobacco and use the car less, a person who smokes and drinks moderately spends as indirect taxes twice their income than the richest: 37 percent versus 15 percent. Therefore, the most effective way to reduce the number of people in need is to tax them less.
According to the Institute of Economic Affairs, cutting special taxes in half and lowering the VAT to 15 percent would reduce tax evasion, the shadow economy and stimulate economic growth. In addition, it would return the money to those most disadvantaged, helping to reduce social spending and government intervention in the lives of taxpayers. The State takes half of the income of workers, but does so in a disseminated way so that the taxpayer is not scandalised.
Methodology
The Tax Freedom Day translates the tax pressure into the number of days that taxpayers need to cover their tax obligations. It is the date of the year in which a person has generated enough income to pay all their taxes. From then on, taxpayers stop working for the State and starts earning money for themselves.
Tax Freedom Day takes into account the income tax, Social Security contributions by the worker and direct and indirect taxes: VAT, Real Estate Tax, special taxes (on alcohol, tobacco, electricity, hydrocarbons …), circulation tax, retail sales tax of certain hydrocarbons, the Property Transfer Tax (ITP) and Documented Legal Acts (AJD), etc.
To calculate the income tax, the different regional tables, the reductions for work income, the personal and family minimums and the different regional deductions of the full quota by large family have all been taken into account. For the calculation of the IBI, three types of dwellings located in the capitals of the autonomous communities have been used. The assignment to each user (who has home ownership) of one of the three types of housing is made based on the level of their annual gross income.
In case of not having data for the capital city or another important city of a given Autonomous Community, the national average is used instead. For the Circulation Tax a car of between 12 and 16 horses has been considered. For motorcycles, an average quota has been calculated for both those with less than 500CC and those with more than 500CC. Since the circulation tax is a municipal tax for each community, the tax applied to the capital of the region has been taken into consideration. In the case of beer, one of 330 ml has been used as a unit, with a volumetric alcoholic strength greater than 2.8% vol. and a dish grade lower than 11.
With respect to the alcohol tax, a glass of 20g of pure alcohol has been taken as a standard unit. For the tobacco tax, the average sale price of cigarettes has been used instead of the maximum retail price for each brand. To calculate this average, the statistics of the Commissioner for the Tobacco Market of the Ministry of Economy and Finance have been used.
In the tax on hydrocarbons, a distinction is made between gasoline and diesel. The average sale price in Spain has been taken. The regional type has also been taken into account.
For VAT, the costs that impact VAT are calculated first. The VAT supported is calculated differently according to the level of income, based on the distribution of household expenditure by expenditure groups and tax rate.
To determine the tax freedom day in each Autonomous Community, a married person has been considered, with a child in charge of the two parents and with a gross income of 24,400 euros. The taxpayer manages to save 1,000 euros a year, has property and car housing, so 200 euros are spent on gas per month. Also, smoke half a pack of cigarettes and drink 7 beers and two drinks a week. Monthly electricity bills reach 50 euros. The arithmetic average of what a taxpayer who earns 24,400 euros (the average salary in Spain) in the above mentioned situation would pay in each of the autonomous communities has been calculated to determine the tax release day for Spain. As for the results, the Tax Freedom Day has been calculated considering only the Social Security contributions by the worker. However, once the contribution to Social Security has been introduced by the company, the tax freedom day is significantly delayed until the middle of the year.
References
European Commission (2015). ‘Study on the effects and incidence of labour taxation’, Taxation Paper No 56.
Fraser Institute (2015). ‘Reforming Federal Personal Income Taxes. A Pro-Growth Plan for Canada’.
IEA (2013). ‘Aggressively Regressive. The ‘sin taxes’ that make the poor poorer’. By Christopher Snowdon. IEA Current Controversies Paper No.47.
Instituto Universitario de Análisis Económico y Social (2014). ‘Los gastos fiscales en la teoría y en la práctica: la merma recaudatoria de un concepto elusivo’. Serie Documentos de Trabajo 05/2014 José M. Domínguez Martínez.
Mercer (2014). ‘Melbourne Mercer Global Pension Index’.
OECD (2014). ‘OECD Pensions Outlook 2014’, OECD Publishing Paying Taxes 2014.
OECD (2014). ‘Pension Markets in Focus’.
OECD (2015). ‘Taxing wages 2015’, OECD Publishing.
PWC (2015). ‘Paying Taxes 2015’.
Tax Foundation (2014). ‘International Tax Competitiveness Index’.
Tax Foundation (2014). ‘The Impact of Piketty’s Wealth Tax on the Poor, the Rich, and the Middle Class’. Special report No. 225.
Thomas Piketty (2014). ‘Capital in the Twenty-First Century’. Arthur Goldhammer trans., Harvard University Press 2014.
WEF (2014). ‘A Framework for Sustainable Security Systems’.


