Executive Summary
The Tax Freedom Day (May 4) intends to make politicians more responsible with public spending and citizens more aware that this money is theirs —or not. In addition, the regional comparison aims to stimulate tax competition among the Autonomous Communities. In addition to the study, the tax calculator serves to make each citizen see more directly how much money the Administration costs. The Tax Freedom Day is the date from which citizens would have generated enough income to cover their tax obligations. From then on we no longer work for the Treasury, but we start making money for ourselves. Tax freedom day translates tax pressure into the number of days workers need to pay their direct and indirect taxes, as well as Social Security contributions.
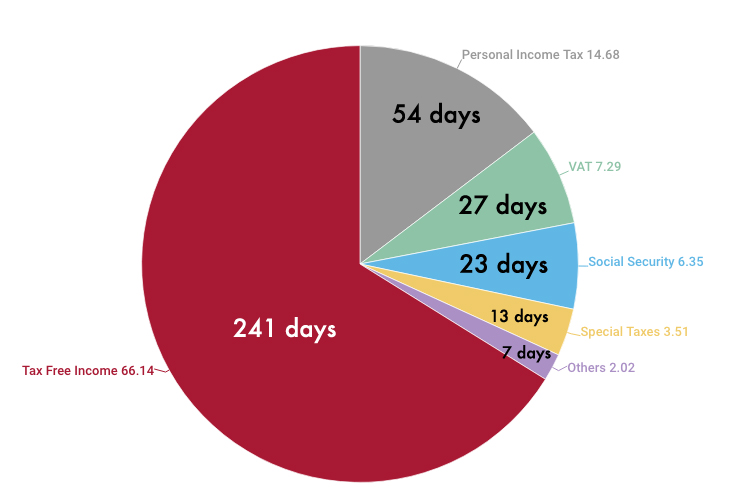
A worker who earns the gross average salary (24,400 euros per year) would be spending 54 days to pay his or her personal income tax, 27 as VAT, 23 as the part of Social Security contributions that comes out of the employee’s gross salary, 13 to special taxes and 7 to other taxes. In total, 124 working days (or 8,261 euros) would be used to pay the Treasury. In addition, his company would quote for any worker an average 29.9 percent of his gross salary (7,296 euros). This means that if these contributions were included as part of the gross salary, the worker would receive an annual salary of 31,696 euros, but would work 179 days (or pay 15,557 euros) for the Treasury. That is, it would work for the State almost half of the year.
The last two tax increases would have required five days of work in total and would cost 320 euros per employee: 127 euros attributable to the income tax increase and 193 euros that can easily be attributed to the VAT increase. In addition, it should be borne in mind that since 2007 salaries are falling at annual rates above 2 percent, so the disposable income after paying taxes would have fallen further. However, not only have these more evident taxes been applied, but also others that tend to go unnoticed. For example, many municipalities have been raising the IBI, which is one of the main causes, along with other local taxes, that in Catalonia the Tax Freedom Day is delayed four days compared to the national average.
Basques vs. Catalans
Several Autonomous Communities have recently increased the personal income tax rate, this is the tax on which this comparison is focused on. On the other hand, taking into account the activities in which an average citizen incurs (see methodology), the differences are larger than it seems: there is a gap of up to 9 days (up to 7.6% percent) more Catalonia than in the Basque Country. For an average Spaniard, living in Catalonia would imply 9 more days of work per year than in the Basque Country. That is, 660 euros more. This is because in Catalonia the Property Tax is well above the national average: more than 500 euros above Navarra, the cheapest Autonomous Community in this regard.
Graph 1. How do you pay your taxes?
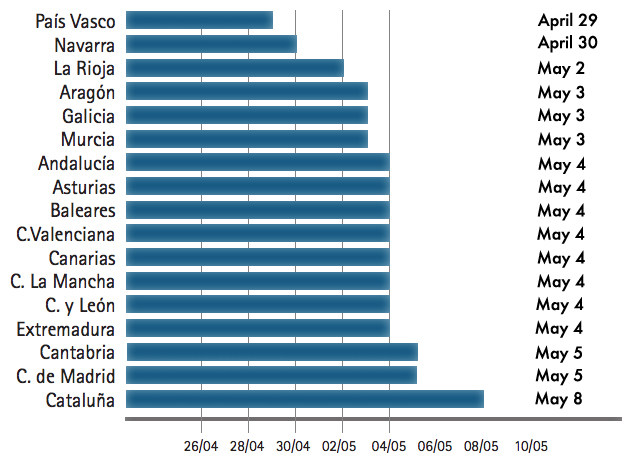
In the Foral Community of Navarra, as in the Basque Country, the tax freedom day arrives at the end of April. That is, 4 and 5 days respectively before the national average. In the case of Navarra, this is due to the differences in income tax with respect to the national average (in Navarra, income tax is 196 euros lower than the national average), but also because of a lower municipal tax burden through of taxes such as IBI (116 euros lower). On the other hand, in the case of the Basque Country, the differences are exclusively because of income tax, so that the Basque Country saves 374 euros in personal income tax alone.
Graph 2. Tax Freedom Day by Autonomous Community
This difference is due to the fact that both Álava and Vizcaya have not modified the types of personal income tax or the intervals, after the last reforms approved at the national level. Guipúzcoa, on the other hand, did increase rates for higher incomes, but it has also increased regional deductions so that its tax freedom day for this level of income is the same as that of Alava and Biscay. Likewise, there are other communities that have also increased tax rates for higher incomes, but these do not affect the tax freedom day, which takes into account an average income.
Instead of taking the average salary of each region for the calculation, the national standard has been used in order to create a guide for the citizen: the province in which, ceteris paribus, one would preferably work.
In the same way, this should also serve to stimulate tax competition among Autonomous Communities, so that they offer a more favourable treatment to the taxpayer even in those taxes that have less ‘electoral cost’. One reason to calculate regional differences in equal pay is to avoid giving the impression that in the richest regions —where taxpayers pay more because they make more—, higher tax rates are charged. Thus, the comparison results makes all other things equal. The clearest example we have in the effects of the financial crisis. Since 2007, the tax freedom day has been set earlier in the year in most countries. For example, Ireland, one of the countries affected the most, went from having its tax freedom day on April 29 in 2007 to April 18 in 2010. This does not mean that the island enjoys better taxation, but that there is a large part of progressive taxes whose collection is sharply reduced when income falls.
Therefore, having the Tax Freedom Day earlier does not always have to be a good event. On the contrary, we must analyse its causes. In addition, calculating each of the figures separately serves to help taxpayers know where they are most demanded so that they can claim accordingly.
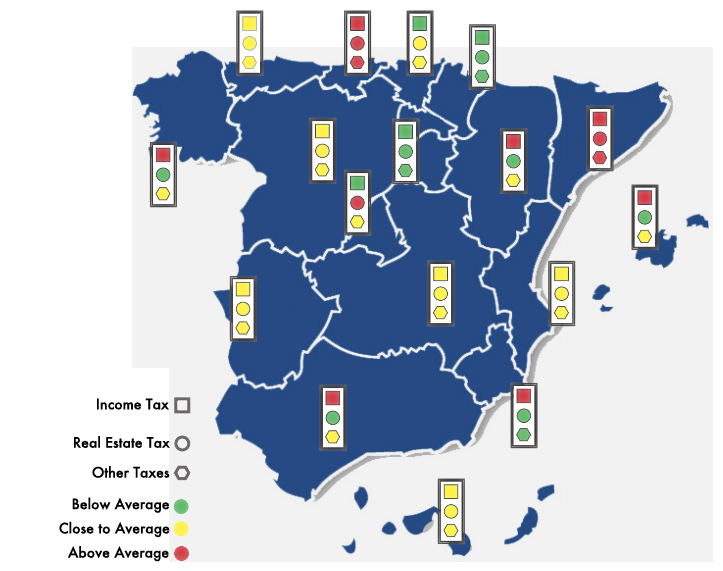
Graph 3. The traffic light of taxes
This graph shows the most important taxes that a person with an average income would pay, by Autonomous Community. For each one, it is assessed if they are close to the average, above or below.
One of the most punished incomes
The tax burden in Spain is relatively low. While in the OECD 35.3 percent of the income is allocated to fund the State expenses, in Spain only 33.8 percent of the resources are used. This figure is well below the EU average, 40.4 percent, but it is not as striking compared to countries on other continents. For example, the United States barely collects 24.8 percent of national GDP, nine points below Spain.
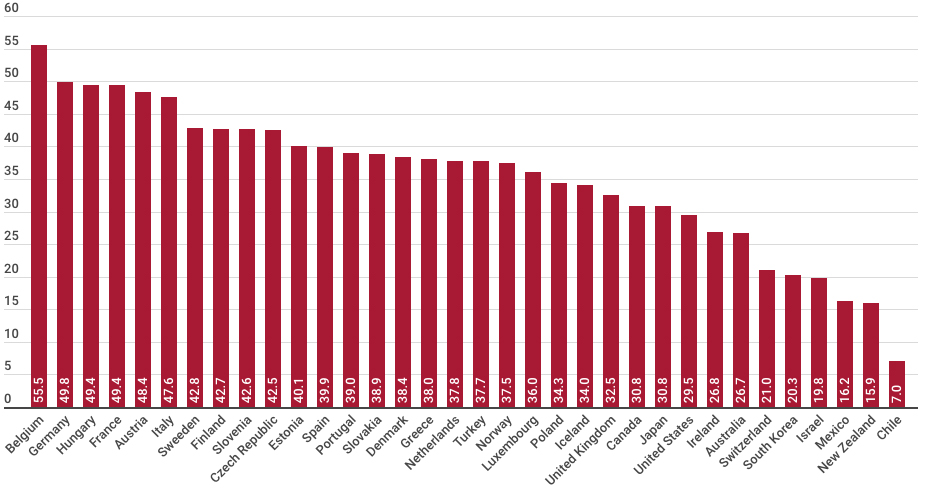
However, wages bear an average levy of 39.9 percent of the total, 5 points above the OECD average. The key is that it is taxpayers who cannot avoid paying them, since the amount is charged directly from the payroll. However, Spain was, after Iceland, the country where ‘punishment’ for workers increased the most in 2010: 1.36 percent. In this year’s report —in which it rises 0.14 percent— this new taxation is still not taken into account, so it is expected that next year it will increase again. This percentage is obtained taking into account, in addition to the Personal Income Tax, tax deductions and Social Security contributions by the company and the worker.
Although these are the highest incomes, 19 percent of taxpayers who charge more than 30,000 euros, who contribute 72 percent of what is collected in the income tax, the income tax is not as progressive as it seems at first glance. The reason is that Social Security contributions are a regressive tax if a certain level of income is exceeded: they represent about one third of the gross salary until it reaches 3,200 euros, but from then on they stop rising.
Graph 4. Tax burden on salaries (2011)
This makes it more profitable for an entrepreneur to raise the salary of those who already make above that figure than raising lower incomes, thus promoting minimum-paid jobs and increasingly sharpening social differences. Therefore, a solution to lighten salary costs could come from lowering the maximum contribution to Social Security, causing the State to cover only a minimum pension. Those who wanted more could save on their own, which would encourage investment and create jobs.
On the other hand, a large part of the benefits of the Welfare State are conditioned to receiving an income lower than a given ceiling, which encourages those who can overcome it by a little bit not to do so or at least not declare it. Thus, it is not surprising that the self-employed declare an average income of 13,525 euros a year, far below employees.
Tax fraud —23.7 percent of GDP, according to Funcas—is largely tolerated because the Welfare State is not perceived as an aid network that prevents a further fall and which then helps citizens, but as a cow be milked before anyone else does. As an example, let us think of Official Protection Housing System (VPO in Spanish), which involves a transfer of income to those who can afford a good part of the payment of a residence, excluding those who cannot take care of an important entry, so they relegate the most disadvantaged to rent.
However, those who acquire a VPO could later enjoy a higher income with which they could face the purchase of a house. It would be much less discriminatory and cheap if, instead, there was some encouragement to access a large rental market, which would allow savings for the purchase or rental of a free home later on.
In addition, this aid network catches many people like a spider web. Spain is one of the most reluctant countries to internal mobility, largely due to the high rate of property ownership —90 percent of Spaniards have one house, in contrast to 50 percent of Germans.
This has several effects: (i) Citizens have more difficulty to «vote with their feet», choosing to live in the territory where public policies that are the most favourable to them; (ii) frictional unemployment is created, because it is more difficult to match labour demand and supply. As there is less quantity and variety of both, workers will be less efficient, because they will be further from finding employment where they can be more productive; (iii) economic growth is wasted, as it is more difficult for citizens to move to the fastest growing cities and escape the most depressed ones; and (iv) the home purchase policy aggravates the cycles of the housing prices. When there is a large rental market and the purchase price goes up, citizens can opt for rent and start comparing when the price drops, which reduces cyclical unemployment.
One way to limit the level of inefficiencies that the benefits produce without reducing the amount of transfers was proposed by Nobel laureate Milton Friedman: implanting a negative tranche in the personal income tax. Explained more graphically, a point is established from which it is considered that a worker can prosper by himself —expandable by the number of children— and a percentage is established, say 25 percent. Of the money that the worker lacks to reach that point of prosperity, the State would contribute a quarter that would support him to approach it.
Thanks to this system, the abandonment of benefits would be gradual and, therefore, the incentives to stay below the level at which benefits are withdrawn are much lower. In addition, as the benefits are obtained through the market, they are more efficient. An example: when Sweden introduced competition from private companies to provide public services, it was able to save up to 8 percent of GDP.
In the current situation, where the deficit goal seems to prevail over everything else, reducing tax pressure seems an arduous and even hardly desirable objective. But showing the degree of current tax pressure can also serve to raise public awareness about the cost of ‘free’ stuff. Instead of raising taxes, which harm the creation of wealth, a part of the solution may involve applying incentives to rationalise the use of public services, so that they reflect a part of the cost of using them.