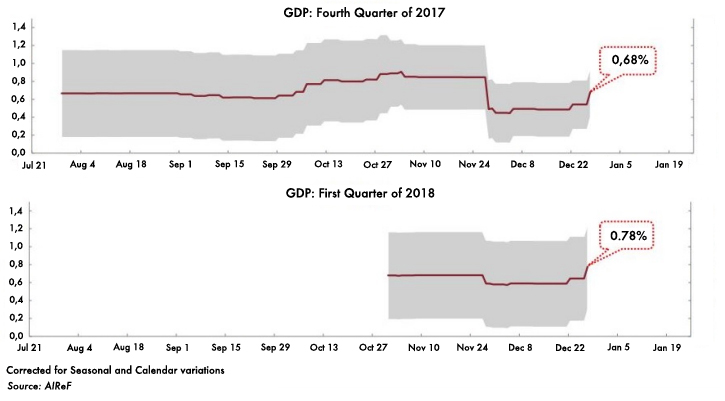
One of the main concerns raised by the Catalan sovereignty process, and the events that it triggered last October, is the amount of money it costs to the Spanish economy, and the possible damage that the long-term productive structure can suffer. In these terms, the Minister of Economy, Luis de Guindos, who has considered an accumulated cost of 1,000 million euros in the last two quarters, has recently spoken. So far, no public authority has ventured an ‘official’ estimate in this regard. Organizations such as the Bank of Spain or the Independent Fiscal Authority (AiREF) have limited themselves to pouring some opinions but without particularly affecting the issue. For example, AiREF, in the framework of its real-time GDP prediction models, has published unstable conclusions, since elements of strong inertia, such as exports via customs data of the Tax Agency, or retail trade with the seasonal effect, are advanced indicators that mitigate the fall in the rate of others, such as industrial orders, hotel overnight stays or seasonally affiliated Social Security affiliations.
Graph 1: Real-time forecast of Catalonia’s GDP growth rate
Therefore, in the absence of official estimates and adopting prudence due to an issue of such caliber, three economic cost approaches are offered below, with different inputs from the macroeconomic point of view.
The calculation of the cost through the SCC Catalan Risk Index
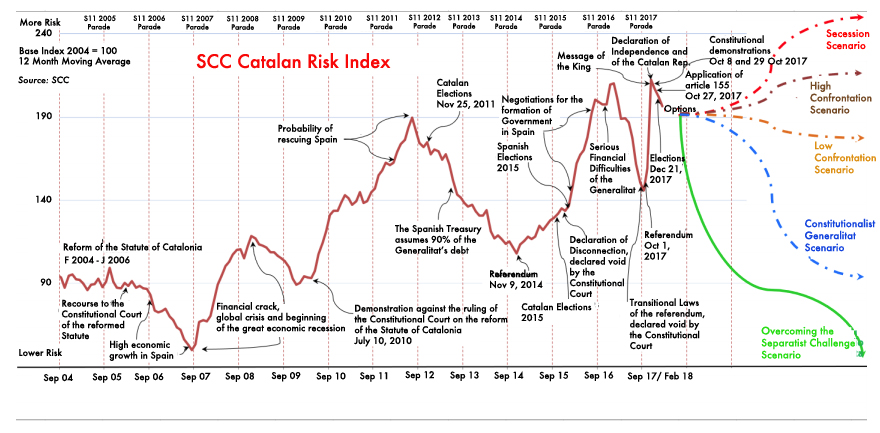
The SCC Catalan Risk Index represents the evolution of the uncertainty associated with the independence movement. From an exhaustive follow-up of proxy variables —especially those related to the volume of news and relevant facts published in the national and international media, about regulatory and institutional changes— there is Index which began in May 2004, based on the methodology developed by Baker, Bloom and Davis (2013). The following advanced indicators are considered in it: Official tender of works, consumption of electric energy, indicator of activity of the services sector, registered cars and registered industrial vehicles, index of turnover of the ex-energy industry, hotel overnight stays and industrial orders.
All this is normalized, making it a base 100. The same is done with a panel of 40 national and international media and, attributing a respective weighting of 60 percent and 40 percent, the index reading with base 100 is obtained in May 2004.
The last reading of the Index, corresponding to January 2018, shows an economic cost close to the historical maximums that it marked in October 2017. Then, the reading was 212.58 (+ 112 percent accumulated since May 2004) attributable to the convening of the illegal referendum on October 1 and the subsequent events that led to the intervention of autonomy. The last data for January reflects a small relaxation to score 196.56 points.
Graph 2: Evolution of the Catalan SCC Risk Index
Cost of the separatist challenge in terms of GDP and real GDP in Catalonia
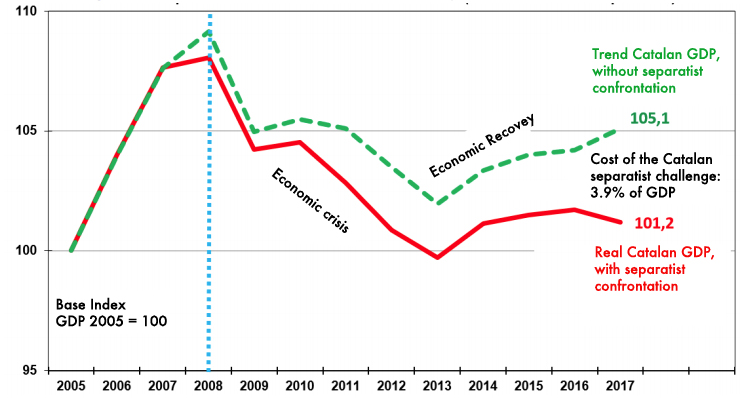
Based on the calculations made by experts from Societat Civil Catalana, another approach involves calculating the output gap, or difference between the observed growth and the potential growth of the Catalan economy. Taking 2005 as base 100, the output gap has grown significantly, even taking into account the crisis between 2008 and 2013. In cumulative terms, the cost measured by the ‘output gap’ would amount to 3.9 percent of the Catalan GDP.
Graph 3: Dynamics of GDP and real GDP of Catalonia
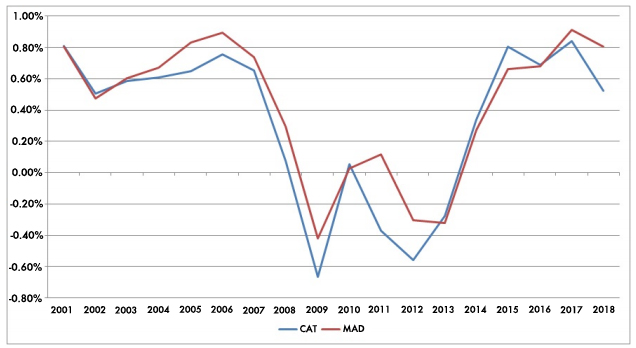
Finally, another way to calculate the cost of the separatist movement is to study the evolution of Catalonia’s contribution to the growth of Spain’s GDP compared to the Community of Madrid. Taking regional GDP data since 2001 and including FUNCAS forecasts, both at the end of 2017 and 2018, for the first time since the economy grew again (in the fourth quarter of 2013), Madrid contributes more to GDP growth national than Catalonia, surpassing it in both nominal GDP and weight over Spain’s total. Specifically, of the national rate estimated by FUNCAS for 2017, of 3.3 percent in real terms, 0.91 percent correspond to Madrid, compared to 0.84 contributed by Catalonia. By 2018, the contributions of both autonomous communities would significantly increase their distance, estimating 0.81 percent for Madrid and 0.52 percent for Catalonia. That is, in just one year, the Catalan economy would lose almost half of its influence on the growth rate of the overall Spanish economy.
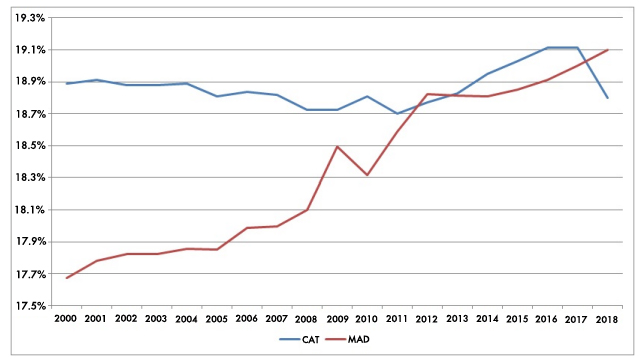
As it can be seen in the following graph, since 2000 the weight of Madrid with respect to the whole of Spain has followed a strongly upward trend, while that of Catalonia has remained practically stable, around 18.9% percent, with a range of variation from two tenths up and down.
Graph 4: Weight of the GDP of Catalonia and Madrid over the national total
If the regional GDP growth rate is added to this, the contribution to the GDP growth of the whole of Spain of the two regional economies has been fluctuating with the economic cycle, but dominated by the continued loss of weight in Catalonia compared to the Community of Madrid, as the previous graph showed. It is worth noting that the advantage with which Catalonia started in its contribution to the growth of Spanish GDP in the first quarters of the period when Spain left recession behind has been completely absorbed by Madrid since the sovereignty process gained greater strength, as of the end of 2015 and early 2016.
Graph 5: Contribution to the growth of the national GDP of Catalonia and Madrid
This loss is not cyclical or due to short-term factors. This is an erosion of a structural nature, which has worsened in the last quarter of 2017 due to the departure of companies from Catalonia, with all that this entails when accounting for the different macroeconomic aggregates in National Accounts. This is due to the change of the fiscal headquarters, which has already been carried out in good part of those of 3,208 companies that have moved until December 29, according to the Association of Property Registrars.
The question of the contribution to GDP growth can also be seen in another way. From the Catalan and Madrid contributions, the differential between the two Autonomous Communities is calculated with respect to their contributions to the growth of national GDP.
Graph 6: Differential in the contribution to the growth of the national GDP of Catalonia compared to Madrid

Since this differential can be considered as structural, adding it since 2004 —date in which the independence movements began to emerge strongly in the negotiation of the Catalan Statute—, it can be seen that the economy of this community has lost 1.73 percent in terms accumulated contribution to the growth of national GDP with respect to the Community of Madrid. Only in 2017, the loss quantified in millions of euros (over the GDP of Spain) amounts to 827.9 million, an estimate very close to the 1,000 advanced by Minister De Guindos. If the effects are added since 2004, it can be concluded that the process has cost 18,535 million euros to this day.