INTRODUCTION: END OF A FISCAL CYCLE
The coronavirus crisis is pushing the Spanish economy, and family finances in particular, to a profound transformation. As the most serious recession in recent history, its consequences for this five-year period completely change the decision-making patterns of households, companies and the public sector. The order to halt the entire Spanish economy for almost two months will mean extending unemployment, liquidity and solvency problems for a long period of time, and will cause an increasing differential in terms of growth, both current and potential, with respect to to the European Union.
The year 2020 marks the end of many cycles. First and foremost marks the end of the economic one, whose deceleration phase already was underway in 2019: it took a matter of a few months to enter a recession, as predicted by the main leading indicators (see, for example, the signals that the Leading Economic Index launched at the end 2019). The end of the «era of complacency» that had been installed since the rescue of Spain in 2012 for the restructuring of the financial system is also imminent. The near future will be marked by a large accumulation of debt over a short period of time, and a serious risk of sustainability that will force Spain to request a new bailout before too long.
Even taking into account the aid that will undoubtedly be provided by the European Union, Spain will be left with a ratio of public debt to GDP of around 115%, according to the latest estimates by the European Commission as demonstrated by heavily indebted countries. Maintaining levels of liabilities greater than the size of the economy is neither sustainable nor convenient. If deep reforms are not undertaken, or those that were left unfinished between 2012 and 2016, are not completed, a scenario of tax increases will become inevitable, as some members of the current Government have already recognised [1].
Despite the inter-temporal inconsistency of fiscal policy in Spain, tax measures have become a cyclical variable. That is, taxes are lowered after the recovery of the economy begins, and raised when the economy reaches the lowest point of the cycle. The experience of the 2008 crisis is but one of numerous historical examples which point to this fact. The cycle of tax reductions that began in 2015 has allowed a gradual decrease in taxes borne by families; tax savings are now again in question.
We are entering a very different dynamic from the one that had been consolidated since 2015. The approval of the Minimum Vital Income (IMV) promises a reform of the welfare state difficult in the short term. Introducing one more structural burden on the already badly deteriorated Social Security accounts does not seem to be the most reasonable, given that there are other more effective alternatives to reach the percentage of the most impoverished population. This demographic is suffering the most during the crisis, as Civismo recently exposed, due to the formulation of a permanent IMV [2] that considerably reduces work incentives [3] and increases tensions between sectors of the population that could face a tax increase relatively soon.
However, families that have lost their jobs and are in a situation of savings recession will rely on public resource transfer systems (such as the IMV), which will generate a perverse dynamics of confrontation between households that have improved their net financial position and those who have worsened it. This will be the most worrying dialectic of the coming months and years, within the scheme of political polarisation that is already infiltrating the middle classes.
A think tank that carries in its DNA the mission of doing ‘tax education,’ works to avoid this situation by revealing to the average Spaniard an essential aspect: the impact that the public sector has on his life, his wealth, and economic and social decisions. This is the commitment of Fundación Civismo, an institution dedicated, from the field of research, to promoting the values of freedom and strengthening of civil society. Within its areas of study, one of the most important is that of taxation, due to its economic impact and how it conditions people’s lives.
Tax Freedom Day responds by not only evaluating taxation, but considering the intervention of the State as a whole. When addressing the former, it compares its effect with that generated by public services such as health, education or pensions, among others [4].
Tax Freedom Day seeks to answer the following questions: How many taxes do we pay in relation to our income? How does the tax burden change according to our age? What effort do families make to comply with the Treasury? Is Spain doing well compared to the rest of the developed economies? What is the economic value of public services? What direct and indirect benefits does a taxpayer receive through public spending?
This report is structured in three parts: in the first, the current situation of taxes and public services is evaluated through the prism of indicators such as the ‘tax wedge’, the ‘tax burden’ and the calculation of “Tax Freedom Day,” both nationally and by autonomous communities. Part II deals with the taxation that will derive from the accumulation of debt after COVID-19, showing the possible scenarios of increasing fiscal pressure and modifying the fiscal fiscal burden.’ Finally, Annexes are included regarding the evolution of income, collection of different taxes, the effect of inflation on personal income tax rates, and the comparative methodology of this study.
PART I: THE FAMILY TAXATION IN THE PRESENT
- The ‘fiscal effort’: how to efficiently measure the real weight of taxes on families
1.1 Introduction
The debate on taxation generally pivots on the following statement: in Spain few taxes are paid compared to the average for the Eurozone. To reach this conclusion, the fiscal pressure (ratio of public income to GDP) is used as an indicator. According to this and with data from Eurostat [5], our country is 7.4 points below the Monetary Union in 2019, which is used to justify tax increases at times of necessary fiscal consolidation.
However, this premise is very far from reality. Measuring the taxes paid by a family or a company from an aggregate ratio, which does not contemplate any type of adjustment for inflation, consumption patterns, employment, production structure or degree of internationalization, leads to incorrect conclusions and the implementation of erroneous solutions that harm economic activity.
Empirical evidence shows to what extent Spanish households pay high taxes, both with respect to their European partners and their ability to generate wealth from the economy. To verify this, it is necessary to rely on two analysis protocols: on the one hand, that of the tax wedge, and on the other, that of the tax burden’.
1.2 The tax wedge
This study begins from the consideration of the two main sources of tax revenue in Spain: social contributions (which are simply a labour tax) and the Personal Income Tax. The latter has undergone numerous modifications in the last decade, especially with the three tax reforms approved in 2009, 2011, and 2015. The first two resulted in rate increases, while the third left some relief, with rate cuts and expansions in exempt minimums and deductions.
Between 2018 and 2019, there was a turning point in terms of tax pressure. Since then, the Ministry of Finance – after various failed budget plans – is placing the emphasis on growing both the tax bases and the collection of the main taxes in a more significant way, proposing tax increases and the creation of new taxes. For example, he is instituting a tax on plastic packaging, financial transactions and digital services. The autonomous communities are behaving similarly, in some cases using their regulatory capacity to continue the path opened in 2015 by the central government, and in others enacting the first notable tax increases.
If we analyse the evolution of the income tax bases and also consider the changes in social contributions, we can calculate the real weight of labour taxes in Spain. This indicator is known as the “tax wedge”: the ratio between labour taxes (Personal Income tax, the worker’s contribution and the company’s contribution) and labour cost.
To study the fiscal tax wedge since 2016, this report performs calculations adjusted to the different cases that taxpayers face according to their age group. As income levels vary throughout our lives, we must note these fluctuations to obtain conclusions that are closer to reality.
Starting from the current salary distribution, we group the population into four large age groups (known as cohorts). The sections are comprised of 16 to 29 years, 30 to 44, 45 to 64, and over 65 years. To each one of these generations of workers, we will assign the corresponding average gross salary, according to the data from the Salary Structure Survey [6].
Initially, we applied the calculation of the «tax wedge» to the assumption of a taxpayer who does not have family charges. In this way, we arrive at a first representative estimate.
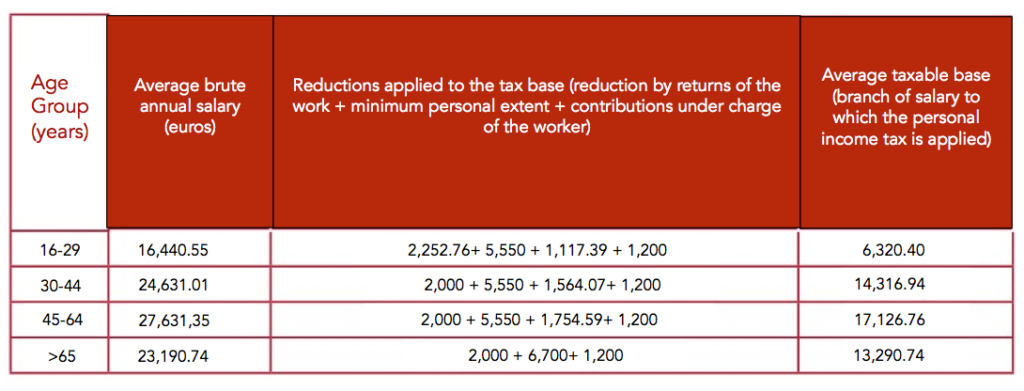
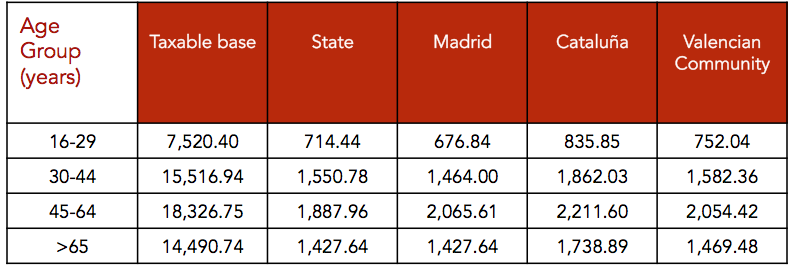
Table 1. Average taxable base of the Personal Income Tax
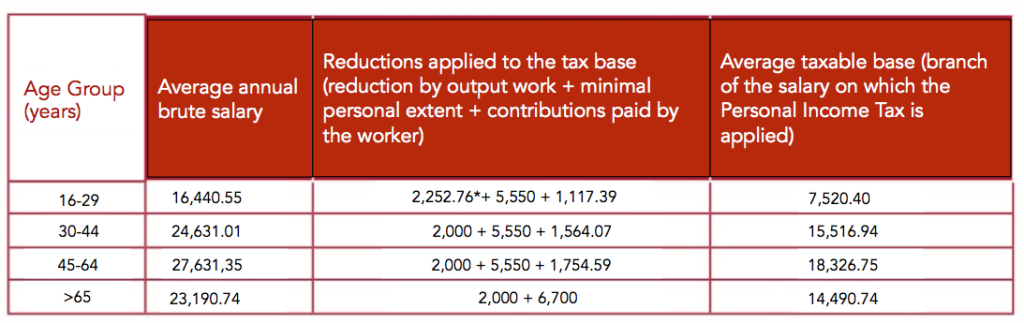
Source: Own elaboration based on INE and AEAT data
As established by the tax legislation born from the 2015 tax reform, and taking into account the changes introduced by the General State Budgets for 2018 (see note in the margin), the calculation of the taxable base contains different reductions in the base. On the one hand, there are the deductible expenses of 2,000 euros in general, along with the reduction for income from work when the net return is less than 16,825 euros. Given that there has been an increase in gross salary in the youngest cohort between 2019 and 2020, the applicable reduction in income is smaller.
On the other hand, the personal and family minimum is currently set at 5,550 euros, and it is increased for those over 65 years of age. In addition, there are also social contributions that are the responsibility of the worker and that appear as a deductible expense to avoid double taxation.
Before continuing with the “tax wedge” calculations, we must highlight one of the most important legislative measures of 2019: the 22.3% increase in the minimum wage, which has led to a symmetrical increase in the minimum contribution base, standing above 1,000 euros in 12 payments. This has translated into an extraordinary increase in the cost of hiring people with lower wages and productivity, less professional qualification and, above all, cohorts of young people between 16 and 29 years old who are entering the labour market or who have been in it for a few years.
Thus, as of January 2019, the labour cost of a newly graduated employees went from 5,216.08 euros (4,302.37 euros of employer contribution and 913.71 euros of employee contribution) to 6,378.84 euros (5,261, 44 euros of employer contribution and 1,117.39 euros of worker contribution): in total, 1,162.76 euros per year more, which has led to an automatic decrease in net salary of 203.67 euros.
So far we have seen the most direct impact of personal income tax and social contributions paid by the worker on their payroll. At this time, we take into account the contribution assumed by the company for the benefit of the worker: a variable that is not normally observed as part of the gross labour cost of each job. Their calculation is reflected in the following table.
Table 2. Social Contributions and brute Labour Cost
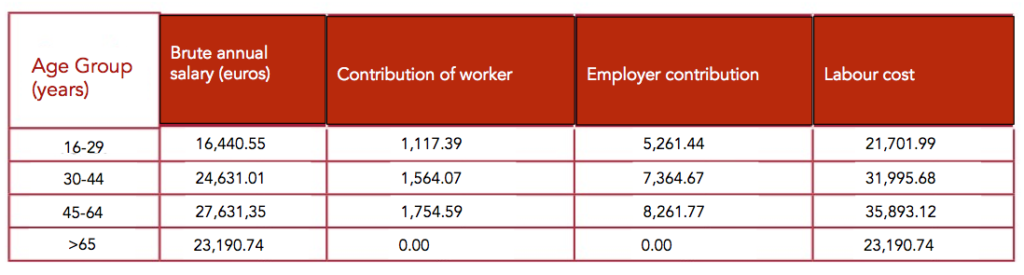
Source: Own elaboration from INE and AEAT data
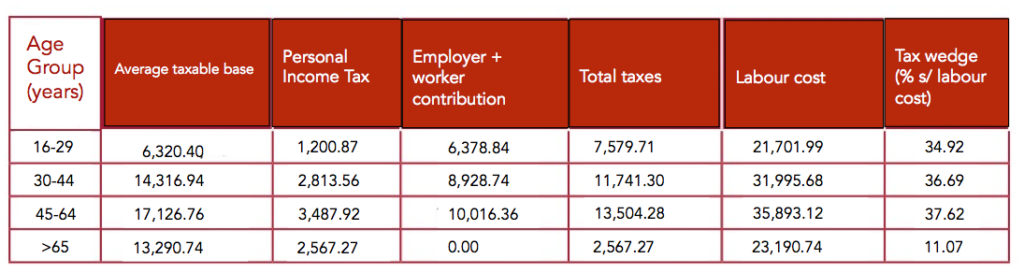
Once the bases applied in personal income tax and social contributions (labour cost) have been quantified, the tax burden on labour costs is calculated. Firstly, in terms of personal income tax on the rates in force at the national level [7]: in the last year, there have been no changes in tax rates, but in some automatic tranches and deductions in installments that we will analyse later. From this, we determine the “tax wedge;” that is, the real weight of labour taxes in Spain in average terms before applying the regional scales. The result is:
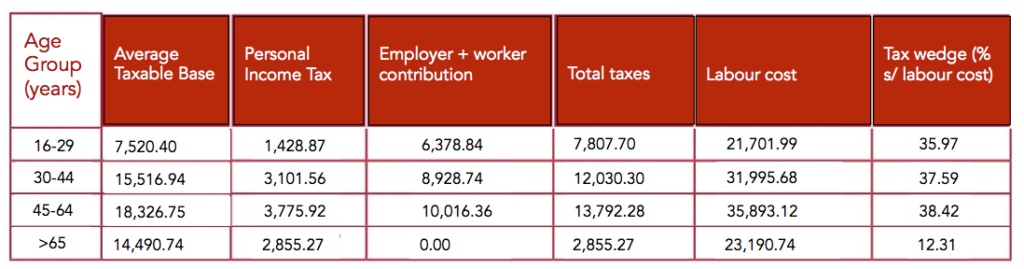
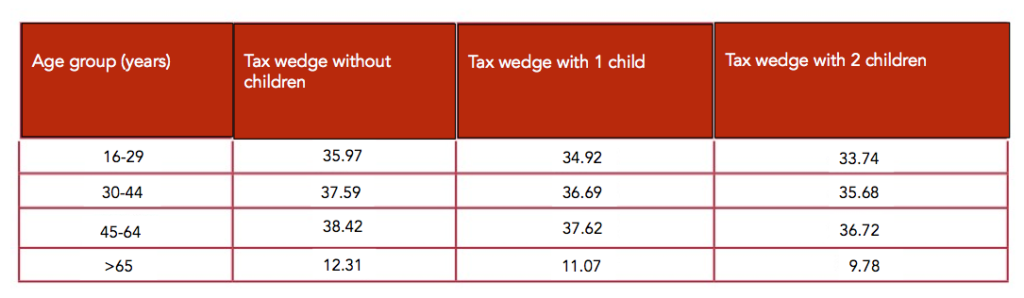
This means that young people between 16 and 29 years old receive 64.03 euros for every 100 of labour costs, which implies a “tax wedge” of 35.97%. For workers between 30 and 44 years of age, Personal Income Tax and contributions assume that 100 euros paid per company and worker remain at 62.41 of effective remuneration, which is equivalent to a “tax wedge” of 37.59%. Those employed between 45 and 64 years (average age of the population) retain only 61.58 euros out of every 100 euros paid by the company to use them, due to a “tax wedge” of 38.42%. Finally, among those over 65 years of age, direct taxation assumes that, for every 100 euros, 87.69 euros are received effectively. In that case, the “tax wedge” reaches 12.31%, given the absence of fiscal pressure exerted by social contributions.
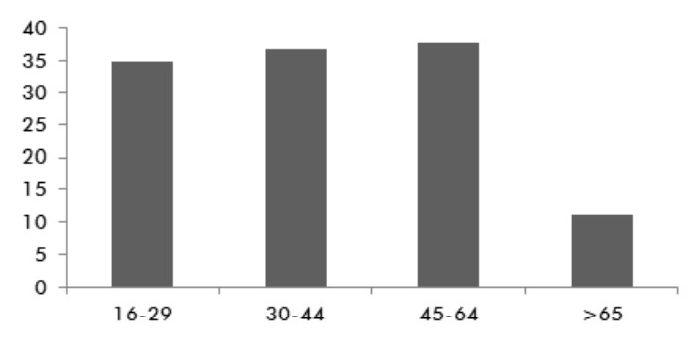
Graph 1. «Tax wedge» (%) for a taxpayer without children, by age group
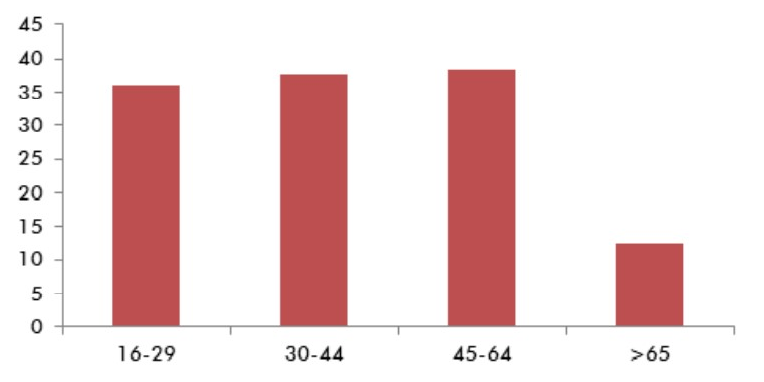
The rise in wage incomes causes a rebound in the tax wedge most notable among the younger population (16-29 years), and less significant in the rest of the cohorts. It can be observed that a smaller increase in salary (564.29 euros per year) implies an end to receiving more than half of the reduction due to income from work and, therefore, that the rise in Personal Income tax ends up being higher than that of one’s own salary (736.54 euros).
In this lies, specifically, the problem of measures such as «salary supplements» that establish subsections within each general tranche. In times of economic boom, these harm the youngest cohorts, and in times of crisis provide a «mattress” as long as the taxpayer was previously subject to making a Personal Income tax declaration. This is the situation that is presented to many of the beneficiaries of the ERTE. A childless worker receives a benefit with an annual cap of 13,200 euros, while with a child the amount amounts to 15,048 euros, and with two or more, 16,932 euros. Even today (as of the closing date of this study), it is premature to assess the fiscal effect, since there is enormous statistical confusion surrounding the beneficiaries of ERTE. A specific chapter should address this topic when there is more clarity about how many workers are receiving this measure of temporary employment. These will have to make their Personal Income tax declaration in 2021, even if they do not reach the minimum mandatory to for the income declaration.
1.3 The tax wedge in the case of families with children
So far we have seen a case in which the taxpayer is neither married nor has children. Now we will calculate the «tax wedge» of Spanish households with one or two children. First, we calculate the average taxable income base for a taxpayer (head of household) with one:
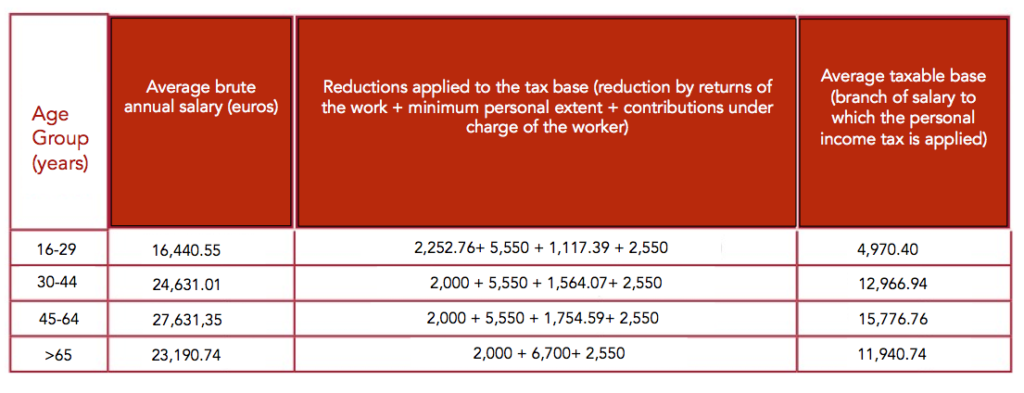
Table 4. Families with one child. Average taxable base of Personal Income Tax
We must bear in mind that a dependent child (who lives with the parents and does not receive income) is deductible until he turns 25. The result of this calculation, reflected in Table 5, shows tax levels ranging from 34.92% to 37.62% in the population of working age.
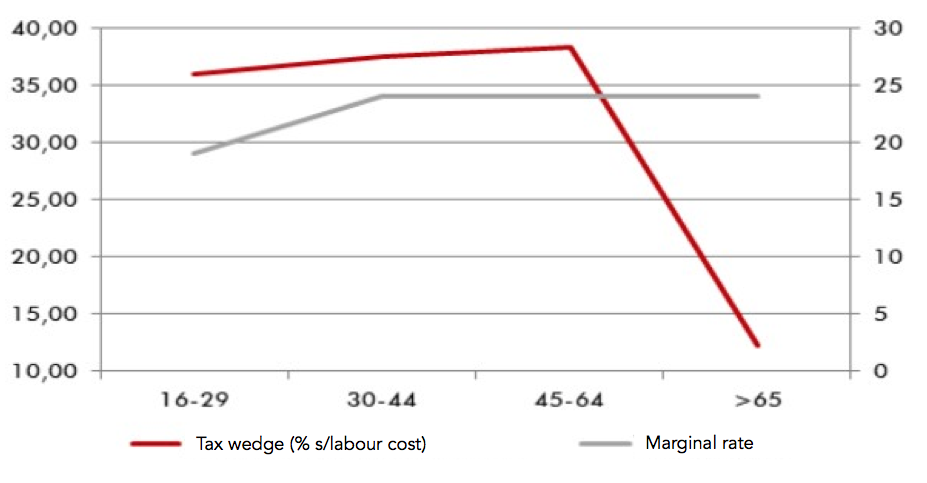
Thus, having a child “softens” the “tax wedge” on average among taxpayers between 16 and 64 years of age. Despite the effect on personal income tax, social contributions do not discriminate based on family responsibilities, which distorts household planning and the incentives that personal income tax introduces for having children.
Table 5. Tax wedge for families with one child
Graph 2. Tax wedge (5) for families with one child
As for the family units with two children, to obtain the information, the average taxable base of the Personal Income tax is calculated first, and the scope of the labour taxes is determined in monetary and percentage terms. The result is reported in the following table:
Table 6. Families with two children. Average taxable income base
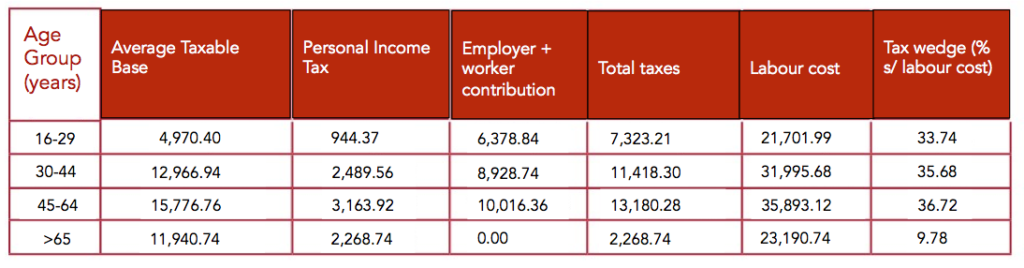
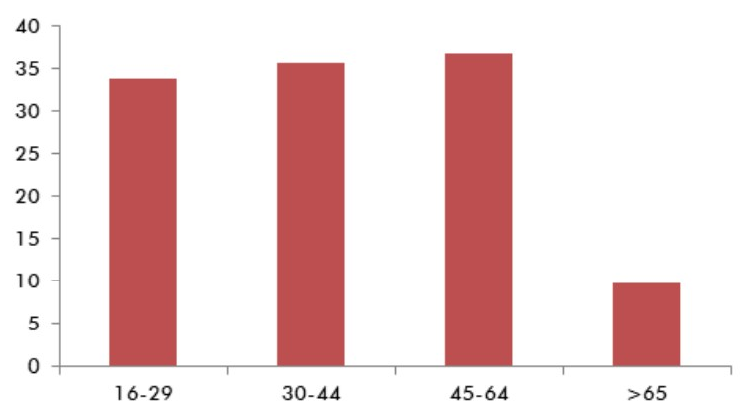
Next, we will estimate the “tax wedge” for the declarations of families with two children (individual declaration). As shown in the following table, this indicator ranges between 33.74% and 36.72% in the working-age population. Thus, a second child reduces, on average, more than one percentage point in each population cohort.
However, the most striking observation is that, proportionally, the greatest tax reduction for this concept is enjoyed by those over 65 years old (1.29 points less than 1.18 for the cohort between 45 and 64 years old, and 0.9 points for the those between 30 and 44 years old). With an aging population, the tax system on income from work (personal income tax + contributions) grants a greater tax reduction by descent from the age of 30 as a function of increasing age, when it should be the opposite. Therefore, late parenting is encouraged; in households whose head of household is over 45 years of age, the tax advantage is ‘extended’ until after retirement age while those children remain at home.
Therefore, the taxation of labour income generates a stimulus contrary to that sought by economic policy. The tax system is aware of the demographic aging process and the need to promote birth rates, but instead of proportionally incentivising younger families, it rewards childbearing in older households.
Table 7. «Tax wedge» in the OECD for families with two children
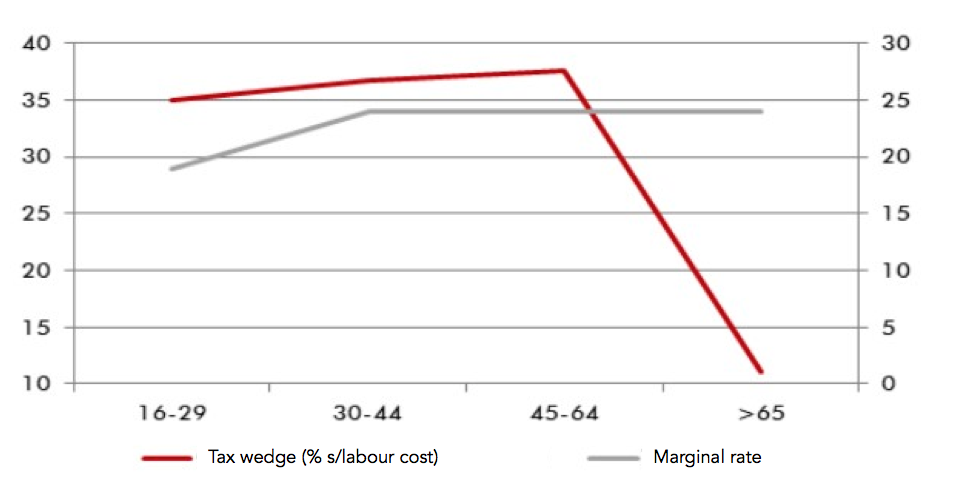
Graph 3. «Tax wedge» for families with two children
The progressivity of the «tax wedge» is distributed as follows among families:
Graph 4. The progressivity of the «tax wedge» for a contributor without children
Graph 5. The progressivity of a contributor with one child
Graph 6. The progressivity for a contributor with two children
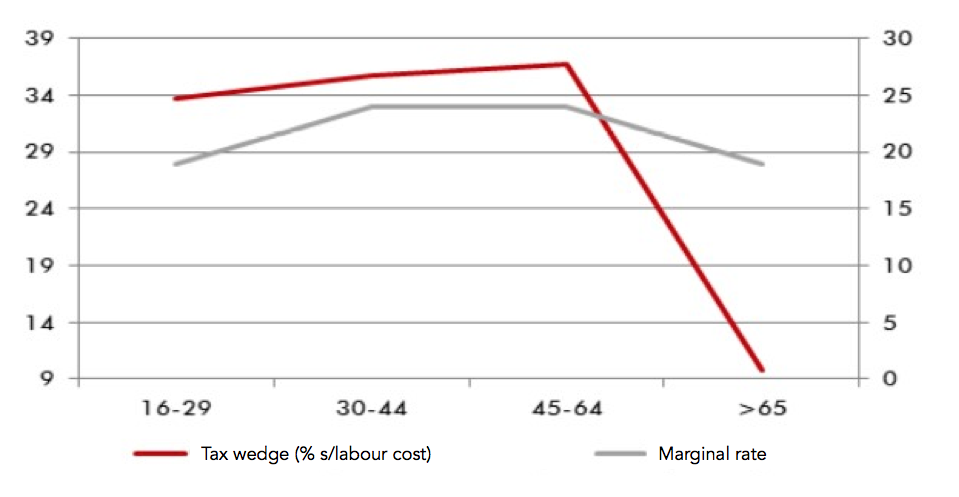
Table 8. Summary
The previous graphs show that the progressivity of the system loads an additional differential effort between the middle and low incomes. Social contributions account for the bulk of the “tax wedge” and explain that, despite the different types of personal income tax, there are no very pronounced differences when we estimate the real weight of taxes according to age groups and income level.
In this matter, not only do the rates set in the prices matter, but also the minimum and maximum of their bases, especially after the entry into force in 2019 of the SMI, set at 900 euros, 22.3% more than in 2018. A bachelor’s or university graduate supports a minimum of 1,466.40 euros in their contribution base (22.3% more than in 2019), while the maximum for all professional categories stands at 4,070.10 euros (7% more). Consequently, a gross salary of more than 48,841.20 euros per year in 12 payments [8] (total labor cost of 63,444.71 euros) pays a fixed fee of 17,704.94 euros per year, if the employer’s contribution and the fee paid by the worker.
In the population distribution by cohorts, the average individual in each age group is within the previous maximum and minimum. However, the sub-distributions of each of the age groups shows a small number of taxpayers who are outside the maximum limit and in which, therefore, progressivity is considerably reduced. A good part of these individuals above the contribution ceiling are high officials who contribute to a private system, or managers who have social insurance that do not depend on the public Social Security system.
1.4 The tax wedge in the world
The «tax wedge» that supports the Spanish taxpayer is among the highest in developed countries. This is proven by Taxing Wages, the annual report published by the OECD on labor taxes. According to said study, the “fiscal wedge” (for a gross average salary without applying a personal minimum in the taxpayer without children and applying the minimums by descendants) is 3.5 percentage points higher in Spain than in the average of the economies developed: 39.5% in our case at the end of 2019, compared to 36% in the OECD average.
In the case of the family unit taxpayer, which is the main source of income for the family with two children, the total tax burden on gross wages in Spain is reduced to just 34.2%, compared to 26.4% on average. of the OECD. This corroborates the previous calculations that pointed out how in Spain the ‘fiscal gap’ for families is widening, via an increase in income taxes, which motivates the payment of one tenth more on labor cost compared to 2018 in the case of taxpayer without children, and four tenths more on labor cost in the taxpayer family unit with two children.
The following graph allows a more visual check of the comparative disadvantage suffered by taxpayers in our country:
Graph 7. «Tax wedge» in the OECD for families with two children
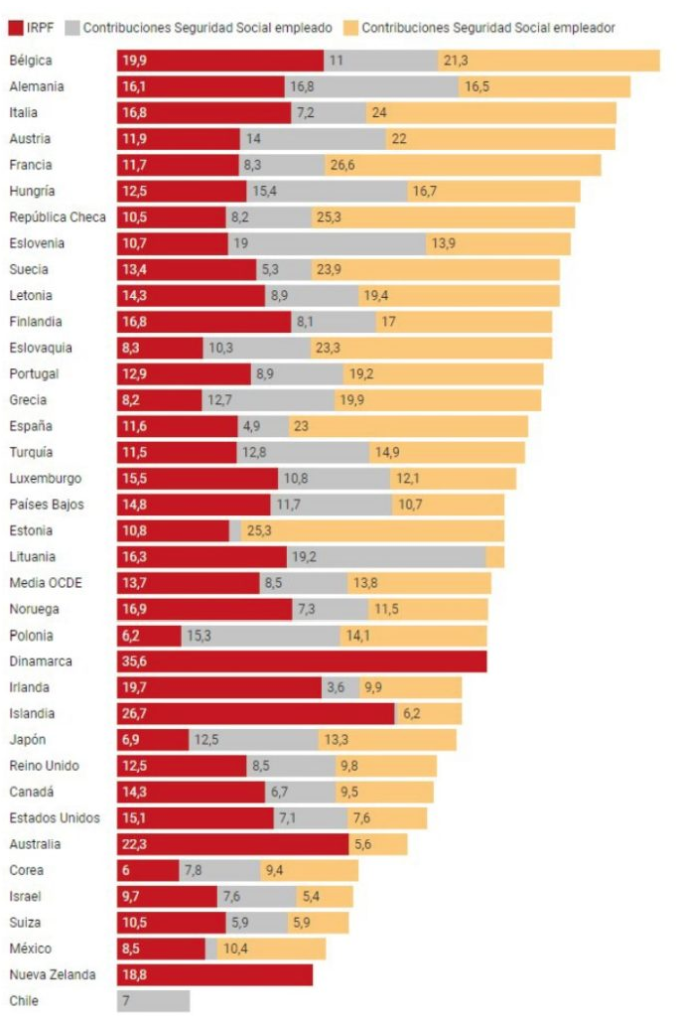
In this sense, 14 of the 36 developed economies integrated into the OECD have a higher “tax wedge” than that of Spain, while 21 bear lower taxes on work. Therefore, the myth that ours is a low-tax country is not correct.
Graph 8. Tax wedge in the OECD for taxpayers with two children
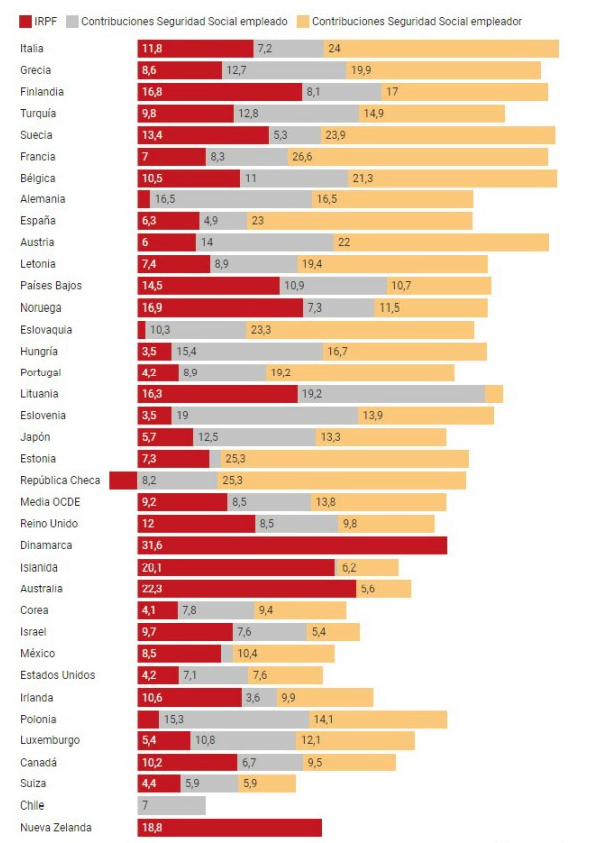
The ‘tax wedge’ on income has decreased between 2015 and 2019, so an individual, childless taxpayer now pays 1.2 percentage points less than before the 2015 tax breaks. However, this downward trend has been broken in the last two years, giving way to further increases in the fiscal effort.
As the OECD data point out, a tax wedge of 39.5% decisively influences the composition, structure and dynamics of the labour market in Spain. Since the 2012 labour reform, employees and employers have negotiated wages in a decentralised manner and at the company level; thanks to this, there is a greater awareness of the ‘total cost’ of generating employment in our country, which carries high structural unemployment due to rigidities in hiring, layoffs and the adaptation of workers and companies to what is demanded by the market.
The framework of job creation is clearly prejudiced against the company: while the worker pays 6.35% in social contributions compared to an OECD average of 10%, the company is responsible over 29.9% of tax rate on gross salary, standing only behind Sweden (31.4%), Italy (31.6%) and France (35.9%). In this way, the system provides a perverse incentive that seeks to contribute on the minimum bases and to choose contribution modalities that suppose a substantial reduction, such as the self-employed regime.
Hence, an essential problem in the labour market consists of formalising part-time contracts when, in fact, the type of employment is full-time and; the market also proliferates false ‘self-employed’ workers in the expansion, for example, of digital platforms.
1.5 The impact of VAT
In addition to labour taxes, the Spanish taxpayer also supports the systematic payment of a battery of indirect taxes, among which the Value Added Tax (VAT) stands out. This tax has three different tranches, which have also experienced severe increases in recent years.
How large is the impact of VAT on our pockets? To determine this, one must first know the average expenditure per household collected in the INE’s Family Budget Survey (EPF). For the last available year (2018), it is 23,653.60 euros for the 16-29-year bracket, 30,299.90 euros for 30-44, 33,502.68 euros for 45-64, and 25,366.29 euros for people over 65. Membership in each age group is set by the household support member (that is, the person with the highest salary).
According to EPF data and calculations by Kenn Garry Chua and Josep Pijoan-Mas [9], 43.9% of this expenditure is subject to the general rate of 21%, while 33.6% carry the imposition of 10%; 13.6%, that of 4%; and 8.9% corresponds to expenses not subject to VAT collection.
Table 9. Household VAT Expenditure
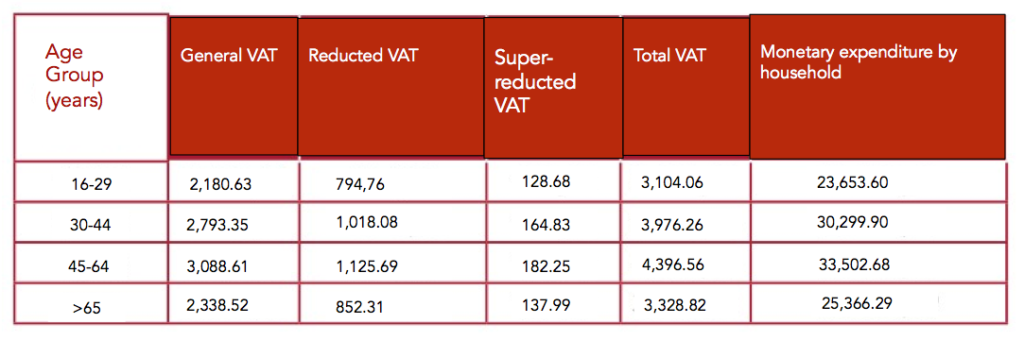
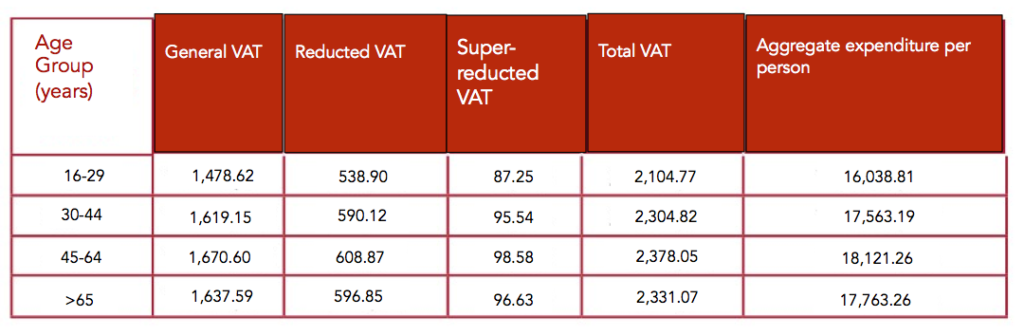
Table 10. VAT Expenditure by unit consumed
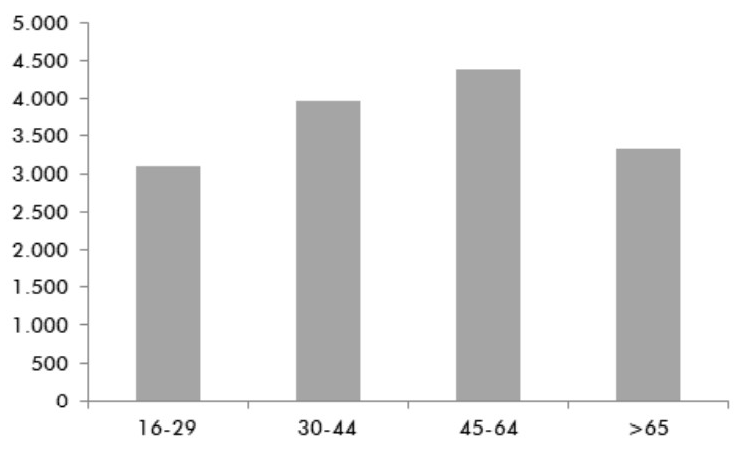
The effective tax burden linked to VAT moves above 13% in all age groups, without major changes even taking into account income distinctions. This is because it is a tax with no progressivity according to income level, as there are no exempt minimums or differentiated rates. For this reason, VAT is always referred to as the quintessential regressive tax. Paying it translates into an annual disbursement of between 3,104 and 4,396 euros, according to the types of households analyzed.
Graph 9. Annual VAT payment per household
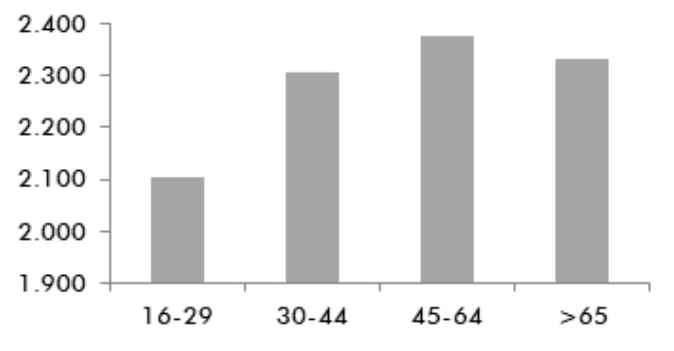
If we treat the VAT per unit of consumption instead of per household, we find that the group between 16 and 29 years dedicates 2,104.77 euros, while the one between 30 and 44 years pays 2,304.82 euros. For generations between 45 and 64 years, it is 2,378.05 euros, and for those over 65, it is 2,331.07 euros per year.
Graph 10. Annual VAT payment per consumption unit (according to age groups)
1.6 Special taxes, assigned to the Autonomous Communities and municipalities
Finally, we consider the average impact of taxes such as Special Taxes (II.EE.), IBI, Wealth Tax, Inheritance and Donations, Property Transfer Tax and Documented Legal Acts (ITP and AJD) and enrollment, between others [10]. Their inclusion stems from the methodology of Tax Freedom Day prior to 2016 (where parameters such as the type of home or vehicle per home are specified), updating the value of these assets each year.
The calculation of wealth by population cohort is especially important, as it is the foundation on which taxes such as Patrimony, Successions and Donations, ITP and AJD or IBI are calculated. It is part of a real estate asset available to the taxpayer, which does not generate income for simplicity. This is consistent with the latest figures published by the Bank of Spain in the 2017 Financial Survey of Families [11], which shows how 71.6% of a family’s assets are real estate (43.3% habitual residence and 28.3% other accessory properties and second homes) and 6.8% correspond to bank deposits that, given the level of interest rates, do not generate explicit returns. In this sense, real estate and wealth taxes have the following breakdown by household:
Table 11. Annual payment of wealth taxed (autonomous and municipal) according to age
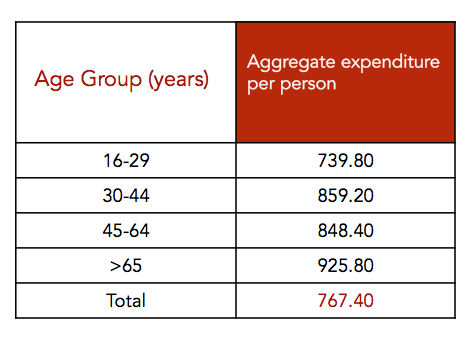
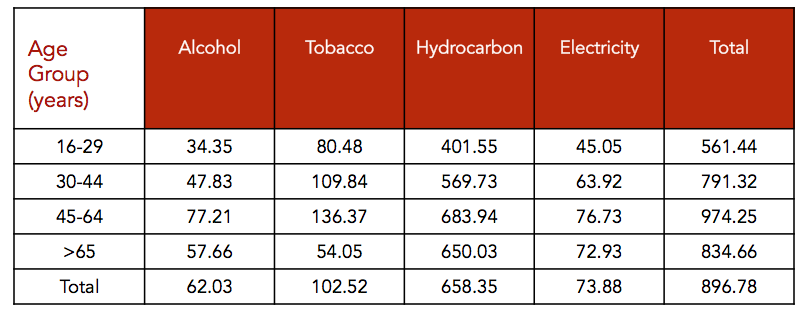
Table 12. Annual payment of Special Taxes per household (according to age groups)
1.7 Tax Freedom Day
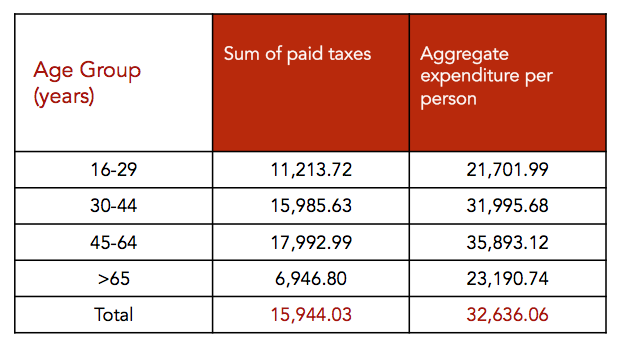
Given all of the above, to calculate Tax Freedom Day it is necessary to add the total amount of taxes paid by each age group, taking into account the individual as the basic unit.
Table 13. Taxed paid by age and average labour cost
Source: Own elaboration
Based on the summary of taxes paid and the labour cost incurred, Tax Freedom Day consists of expressing the total amount of taxes paid by a taxpayer in Spain, translated into the number of days he needs to generate income and meet all his tax obligations. This calculation includes the already detailed figures of Personal Income tax, Social Security contributions, VAT, II.EE., and regional and municipal taxes.
For 2020, Tax Freedom Day arrives on June 26, four days before the deadline for filing the personal income tax return for taxpayers who do not make direct debit and whose balance came out «to be returned.” The date, therefore, varies by one day compared to 2019 onyx because 2020 is a leap year. Thus, the number of days dedicated to paying taxes remains the same: 178.
In the total case, the average salary of 25,123.99 euros is taken, which implies a total labour cost of 32,636.06 euros. The Social Security payment is broken down as follows: 7,512.07 euros of employer contribution and 1,595.37 euros of worker contribution. Regarding Personal Income tax, the payment is 3,212.36 euros, VAT is 1,960.05 euros; the II.EE., 896.78 euros; and the fully ceded, autonomous and municipal taxes are equivalent to an amount of 767.40 euros. In total, tax payments amount to 15,944.03 euros.
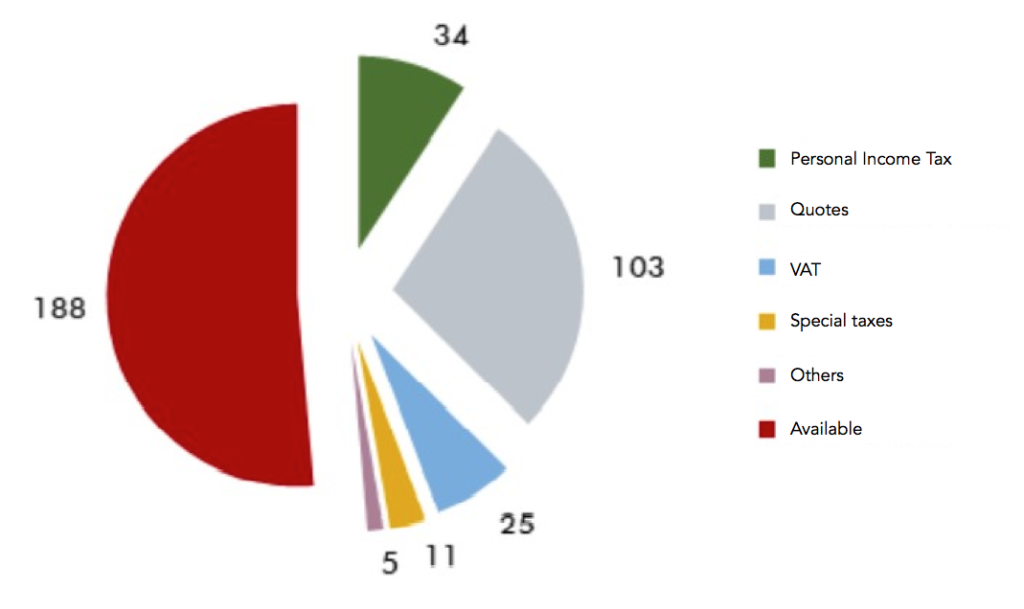
Thus, the average taxpayer dedicates 178 days of salary to comply with the Treasury with the following distribution: 103 days for social contributions, 34 for personal income tax, 25 for VAT, 11 for II.EE., and 5 for other taxes (IBI, Heritage, Registration …).
Unlike what happened in 2019, there are no significant effects on the days of salary dedicated to paying the different tax figures. The most substantial changes are movements of the opposite sign in the autonomous sections of the personal income tax and wealth taxes (Successions, Patrimony, IBI or ITP, among others) in the Autonomous Communities, as will be seen in Section 3.
Graph 11. Weight of the different taxes on Fiscal Liberation Day
Graph 12. Evolution of Tax Freedom Day 2002-2020
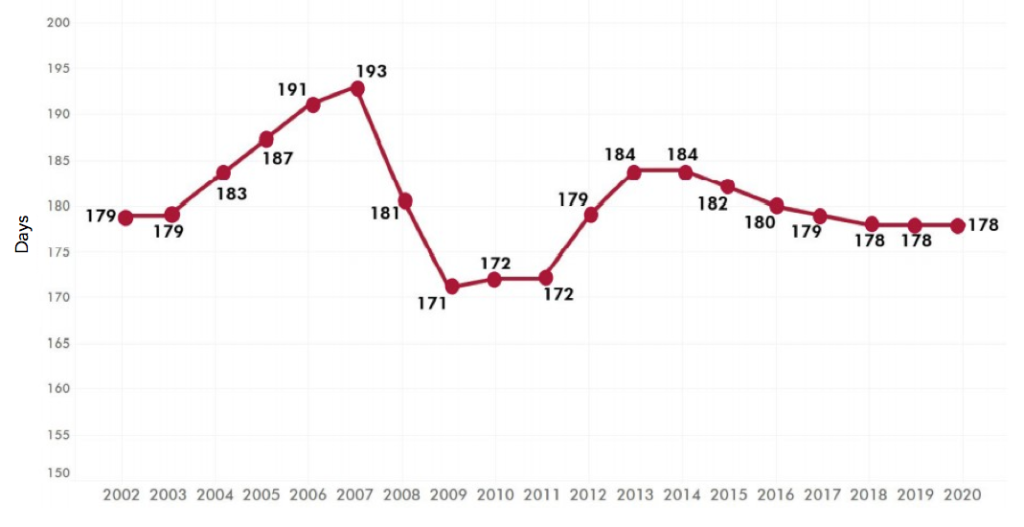
The two previous years (2018 and 2019) marked a stability in the total number of days, although its internal composition has changed, as will be seen later in the regional analysis. This is the trend that can be broken in 2021 if the threat of tax increases is finally fulfilled.
2. THE TAX BURDEN: THE RELATIONSHIP BETWEEN TAXES PAID AND PUBLIC SERVICES RECEIVED
The analysis of taxation and its influence on families would not be complete without considering the variable of public spending; that is, if taxes paid are not compared to how much is received from the State in the form of present and future public services. Here the tax burden indicator comes into play, which relates both variables.
Fundación Civismo made the first study in Spain in this regard on the “Tax Freedom Day” of 2018, in which it showed the mechanism of tax redistribution and inter-temporal spending through which the cohorts of working age pay more taxes than the public services that they receive in exchange for obtaining a public pension at retirement. Precisely, it exposed how the measures taken on pension spending since 2018 further distorted this contribution-benefit balance, making it profoundly disadvantageous for younger generations.
With the latest available data on spending, taxes paid, labour cost (as an indicator of gross salary) and minimum subsistence, the tax burden ratio is calculated for the working age population.
As concluded on the Tax Freedom Day of 2018, those over 65 receive more benefits than they contribute via taxes. This is the moment in which they benefit from what they have paid during their working life, specifically 103% of the gross income discounting the vital minimum.
Graph 13. Tax burden as a percentage of gross available salary
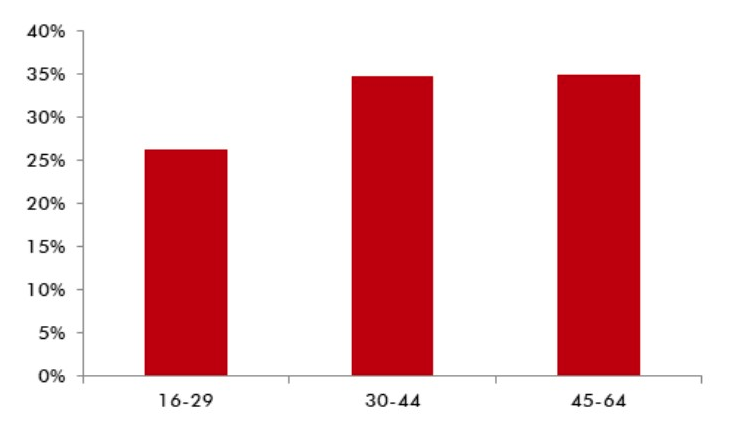
Young people assume a net tax burden (discounted from public goods received) of 26.3%, while for the rest of the population of working age it is 35%, with little difference between 30-44 years and 45-64 years, sectors in which the increase in taxes is accompanied by a proportional growth in public benefits — for example, in the form of tax benefits for children and a greater consumption of health and educational services.
These numbers show how workers of working age agree to pay for 35 years (standard career contribution) between 3,515.33 euros (in early working age) and 7,775.23 euros (in adult ages) above what is received in services to obtain a net benefit in the form of a pension, health and dependency amounting to 17,768.49 euros per year for 20 years.
Therefore, this affirms the contribution-benefit balance in the citizen’s head, but under a system that is financially unbalanced [12] where most of the measures for redistribution of spending have not previously been accompanied by a redistribution of income (for example, in the case of Minimum Vital Income). Thus, workers are forced to redistribute their income and expenses with savings inter-temporal redistribution), being aware that the ‘profitability’ of paying taxes is reduced: on the one hand, because of the net present value of the pensions accrued to be received from the age of 65 onwards and, on the other hand, for the expected value of the contributions of both the employer and the employee up to the date of retirement.
To balance contributions and benefits in inter-temporal terms and achieve a neutral ‘tax burden’ over time, in an amount of around 300,000 euros at net present value at age 65, one would have to use an index of pension revaluation (IRP) of 1%, which is certainly far from reality, given the policy of the last governments.
3. TERRITORIAL ANALYSIS OF THE TAXATION
3.1 The Day of Fiscal Liberation by Autonomous Communities
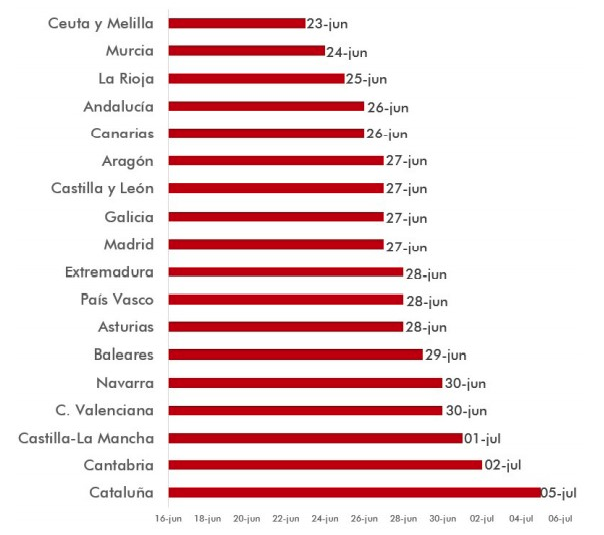
Fiscal Liberation Day arrives on the following dates to the different autonomous communities:
Graph 14. Fiscal Liberation Day by Autonomous Communities in 2020 (Taxpayer without children)
As noted above, in 2020 there have been changes in Personal Income tax and other fully assigned taxes, such as Equity, Successions and ITP, which affect the internal composition in the payment of taxes by Autonomous Communities without a increase or decrease in the country as a whole in terms of number of days of salary.
In this sense, the most relevant changes for the purposes of effective real taxation (leaving aside the modifications in deductions of little relevance to the generality of taxpayers) are:
- Significant decrease in personal income tax in Andalusia, together with ISD and ITP.
- Sharp rise in taxes in Catalonia on high incomes (with expansion of personal minimums on the lowest incomes [13]) and unprecedented creation of new own taxes.
- IRPF rise in the Canary Islands to high incomes.
- Slight reduction in Personal Income tax in Navarra in the lowest-income segment by expanding the limits to apply the deduction for work, but combined with a notable rise in Heritage and Successions and deflation of rates.
- Deflation of Basque Provincial Treasuries tariffs, increasing the amounts of each income threshold.
- Gradual reduction of income tax in Murcia, both in types and deductions, including a new deduction for school expenses [14].
Of all of them, those that have an impact on the number of days of salary dedicated to paying taxes are the tax breaks in Andalusia and Murcia, and the rise in Catalonia.
3.2 The tax profile of personal income tax by Autonomous Community: the case of the taxpayer without children
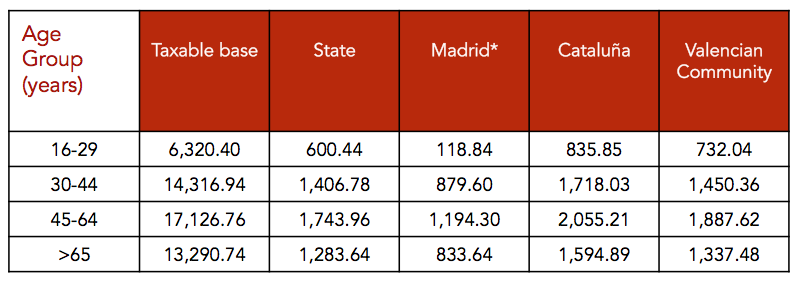
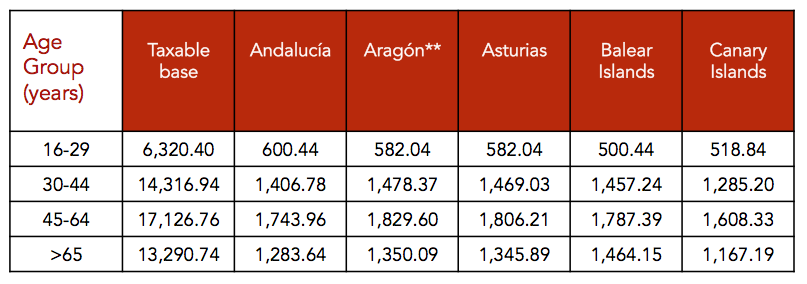
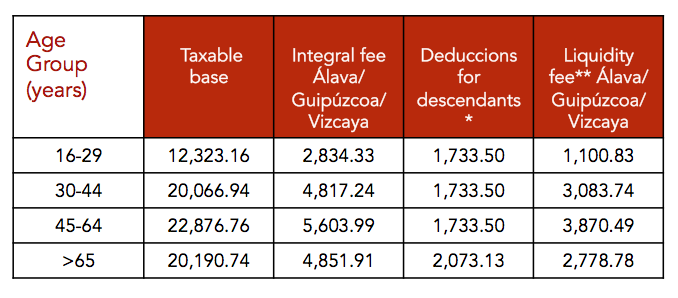
Table 14. State liquid quota and that of the Common Regime Autonomous Communities and population cochort. Childless taxpayer.
We add the state and regional liquid quotas (except in the regional regimes) to calculate the real effective tax rates by population cohorts. In this way, we measure the real tax effort of families in each of the Autonomous Communities.
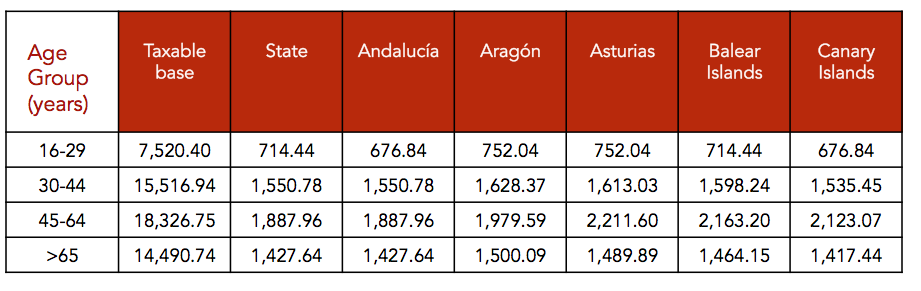
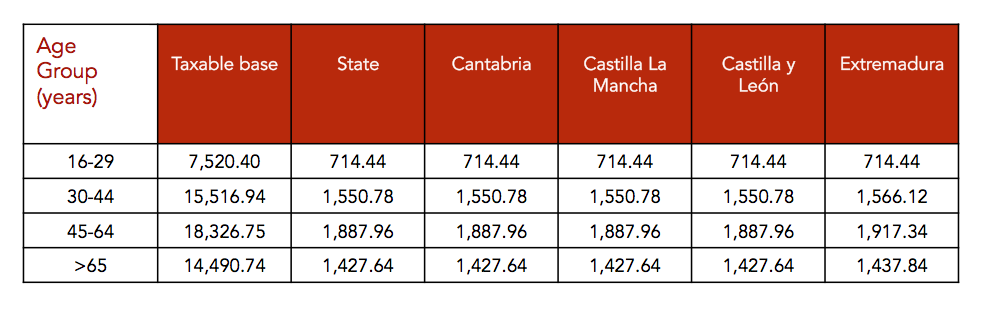
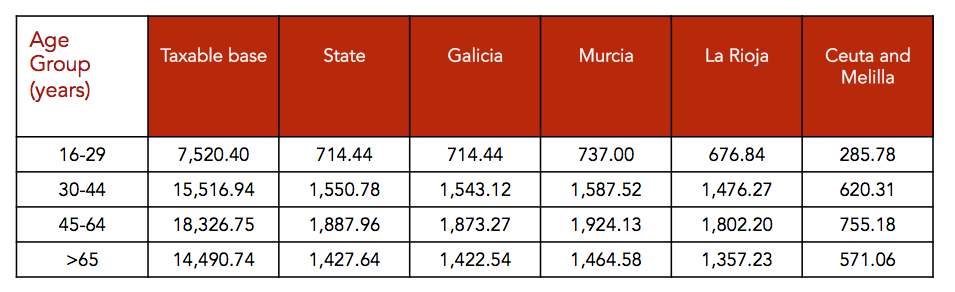
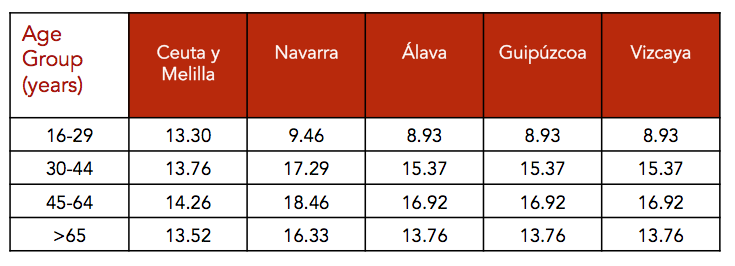
Table 15. Full fee and liquid fee for taxpayer without children in Navarra
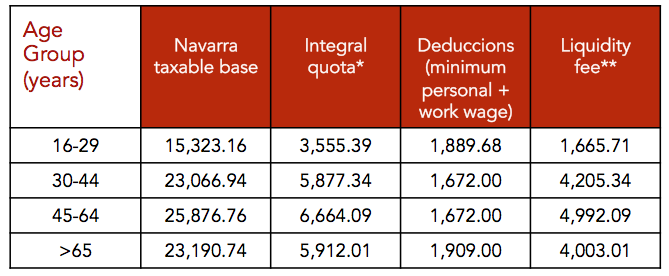
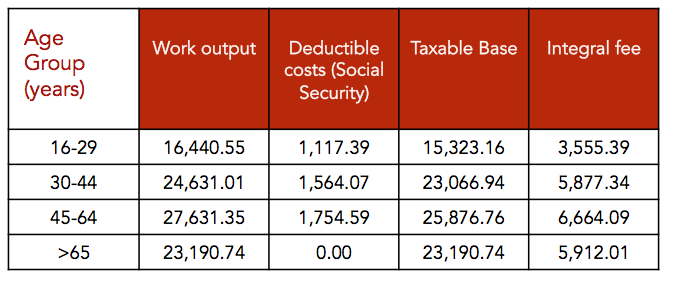
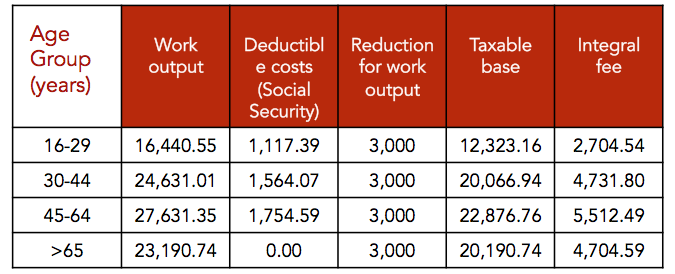
Difference= integral output – deductible costs
Up to 7,500 euros
7,500 euros and 15,000 euros
More than 15,000 euros
** For Navarra, there is a personal minimum established which is included as a deduction in the integral fee of 972 euros with a general character of 1,209 euros when the contributor is older than 65 years. Furthermore, a reduction of work output of 700 euros is also counted as a deduction in the integral fee when the net returns from work are between 12,600.01 and 35,000 euros.
Both the determination of the full quota [15] and the liquid quota [16] are detailed at the bottom of the page.
The differences in the income tax payment are even more evident for those individuals who have more income or who are in the highest marginal rates (for example, for 2020, it moves between 43.5% in Madrid and 48% in Catalonia, or even above 50% in Navarra for taxable bases exceeding 175,000 euros).
Table 16. Full fee and liquid fee for taxpayer without children in the regional government of Álava, Vizcaya and Guipúzcoa
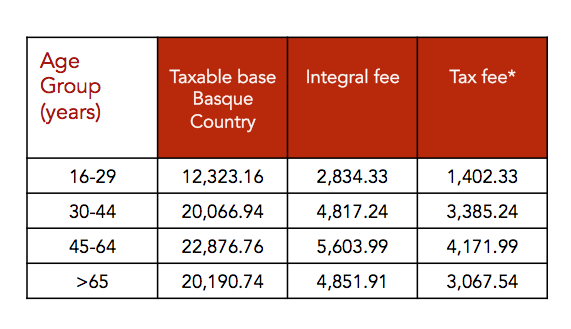
In the case of the retirees, there exists a minimum deductible of 346 euros with a general character for those older than 65 years and one of 632 for those older than 75. In the case of a tax base between 20,000 and 30,000 euros, these minimums are deducted by a factor of 0.0334(BI-20,000).
Due to the fiscal changes in Vizcaya and Guipúzcoa, Álava has a light difference with respect to the two provinces in its integral fee. Because it is so small, it is not accounted for in these calculations.
3.3 The Personal Income Tax profile by Autonomous Community: The case of the individual taxpayer with a child
Table 17. State liquid quota by Autonomous Community: the case of the individual taxpayer with a child
Taxable Base
Up to 6,500 euros
Between 6,500.01 euros and 10,000 euros
Between 10,000.01 euros and 12,500 euros
Deduction
50 euros
37.5 euros
25 euros
In the case of Baleares, the quantities are doubled for each one of the branches. In Canarias, a deduction of 100 euros per child is applied for school costs, and 1,500 euros for those of university age, while in Extremadura a general deduction of 7.5 euros per child is granted by individual declaration.
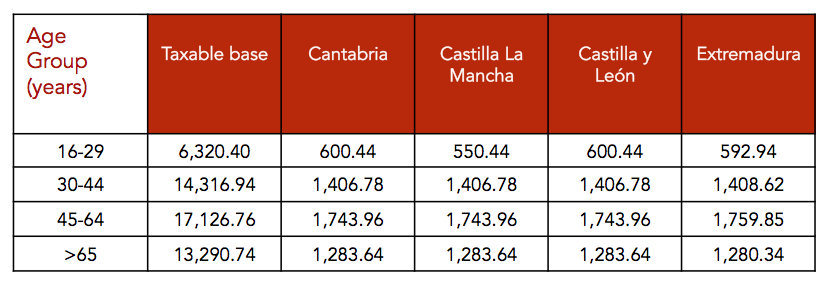
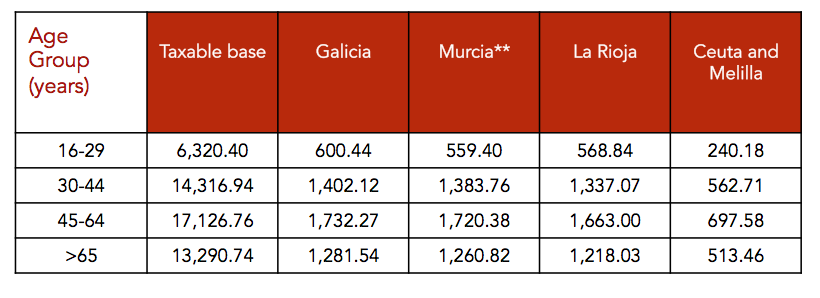
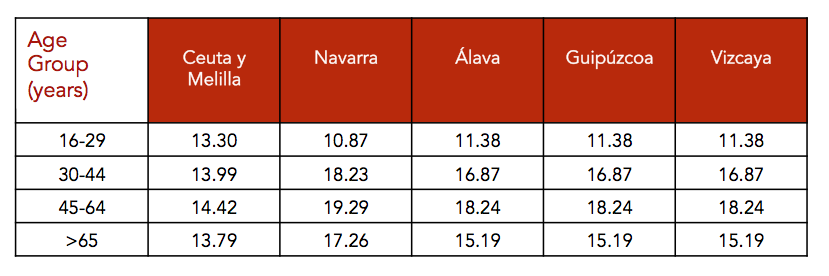
Table 18. Navarra. Taxpayer in family unit, individual declaration and son over 6 years
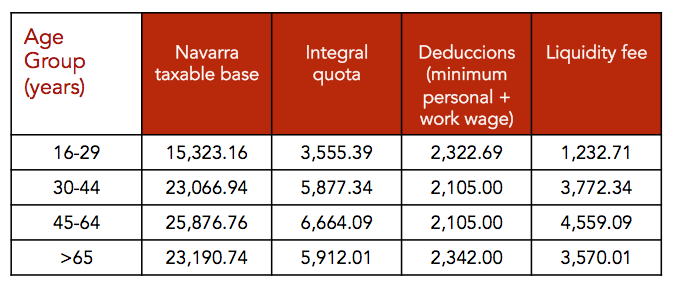
Table 19. Full fee and liquid fee for taxpayers in a family unit, individual declaration and with a child over 6 years in the Basque Provinces (slight difference in Álava)
** Deductions of the integral fee: There is no minimum personal deductible en the integral fee (except for retirees) but yes for families: 585 euros for the first child and 724 euros for the second child, as long as they are older than 6 years. If they are younger than 6 years, the deduction increases by 335 euros.
En the case of retirees, there exists a minimum deductible of 334 euros with a general character for those over 65 years and a minimum deductible of 612 euros for those over 75 years. In the case of of tax base in between 20,000 and 30,000 euros, these minimums are reduced by a factor of 0.0334(BI — 20,000).
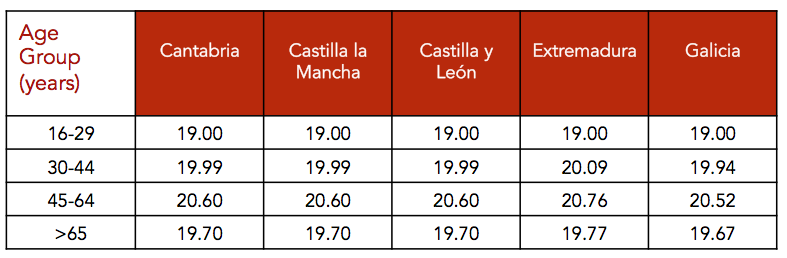
Table 20. Average effective rates
In short, having a child does not significantly reduce the effective rate of Personal Income tax, neither in Catalonia, nor in Asturias, nor in Valencia. Although it is true that more reductions are applied in the tax base due to this fact, they are not enough to “jump the stretch” and considerably reduce the tax bill.
In the case of the communities of regional government, Navarra experienced a slight growth compared to the Basque provinces, where a homogeneous pressure of around 18% was maintained in the income brackets studied.
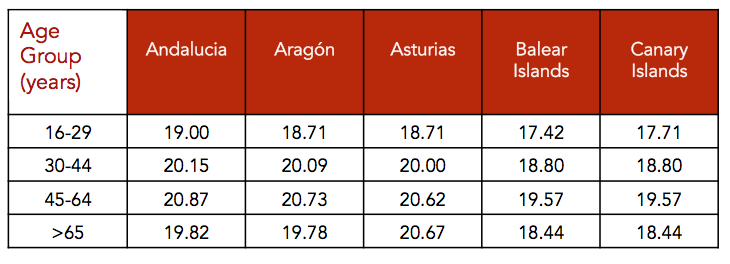
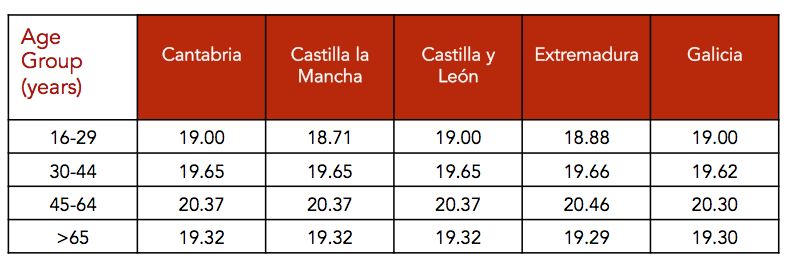
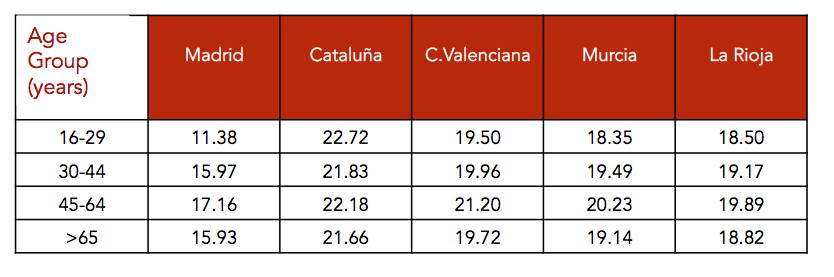
3.5 Average effective rates by population cohort and Autonomous Communities for the taxpayer without children
Table 21. Average effective rates

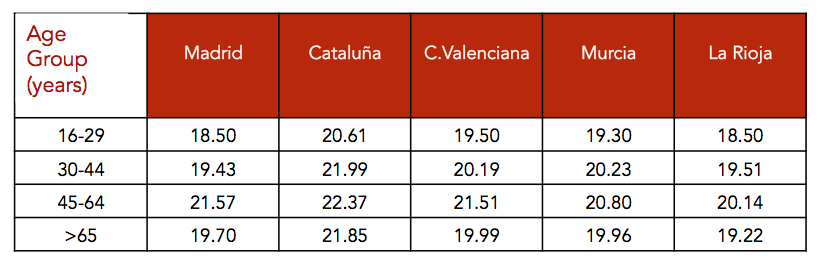
In the age group with the highest income, we observed that in terms of Personal Income Tax and within the communities of the common system, Catalonia, Asturias and the Valencian Community exert a greater real fiscal pressure on salaries. By contrast, in La Rioja, Galicia and Andalucía the taxpayer between 45 and 64 years of age without children bears a smaller tax burden. The jump experienced by Andalusia in the reduction of taxes stands out.
In the case of the regional system, the increase in the section thresholds has slightly reduces tax relief for lower income taxpayers in Navarra, Vizcaya and Guipúzcoa. Specifically, the second cohort pays 0.21 points less of the cash rate; the third, 0.29 points; and the last one, 0.07.
3.6 How much do the rich pay?
How does taxation affect the wealthiest taxpayers? If we start from one without children who earns 150,000 euros gross per year, we see that their «tax wedge» is 48.03% in the autonomous communities of the common system, and that it amounts to 50.30% in the Basque Country and 52.75% in Navarra.
Table 22. «Tax wedge» for a gross income of 150,000 euro per year
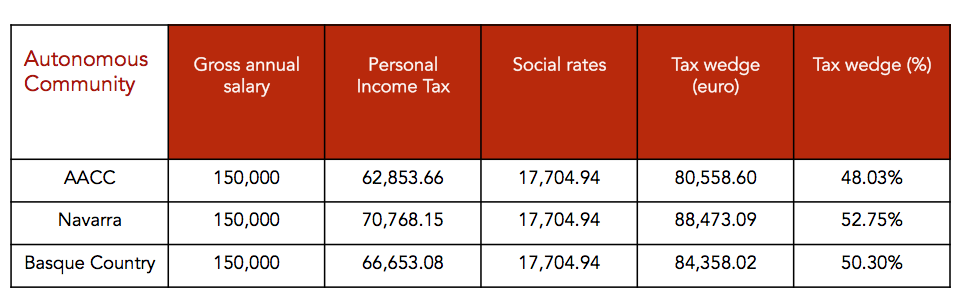
Source: Own elaboration
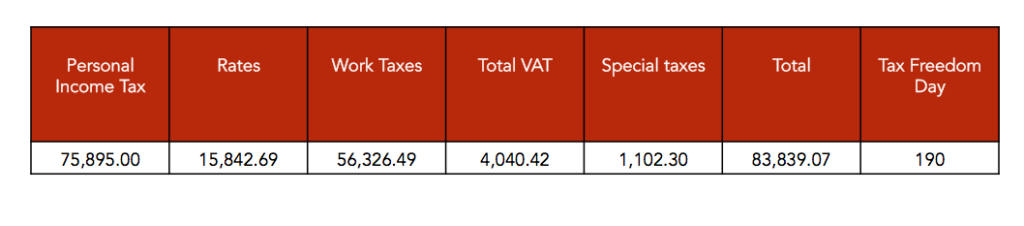
The 7% increase in the maximum contribution base to Social Security has a reduced impact on the tax wedge (the denominator increases more than proportionally with respect to the numerator). As we have already seen, Tax Freedom Day includes the tax wedge but also VAT, the II.EE. and other liens. If we make this calculation for the assumption of the worker with a salary of 150,000 euros, we fins that he needs 190 days of salary to comply with the Treasury. The increases in the high sections of the Personal Income Tax applies in five regions (Aragón, Baleares, Cantabria, Galicia and La Rioja), plus the increases that occurred in 2016 in Navarra, force a taxpayer of these characteristics to lengthen their fiscal effort two more days every year.
Table 23. Tax Freedom Day for an income of 150,000 euros gross per year
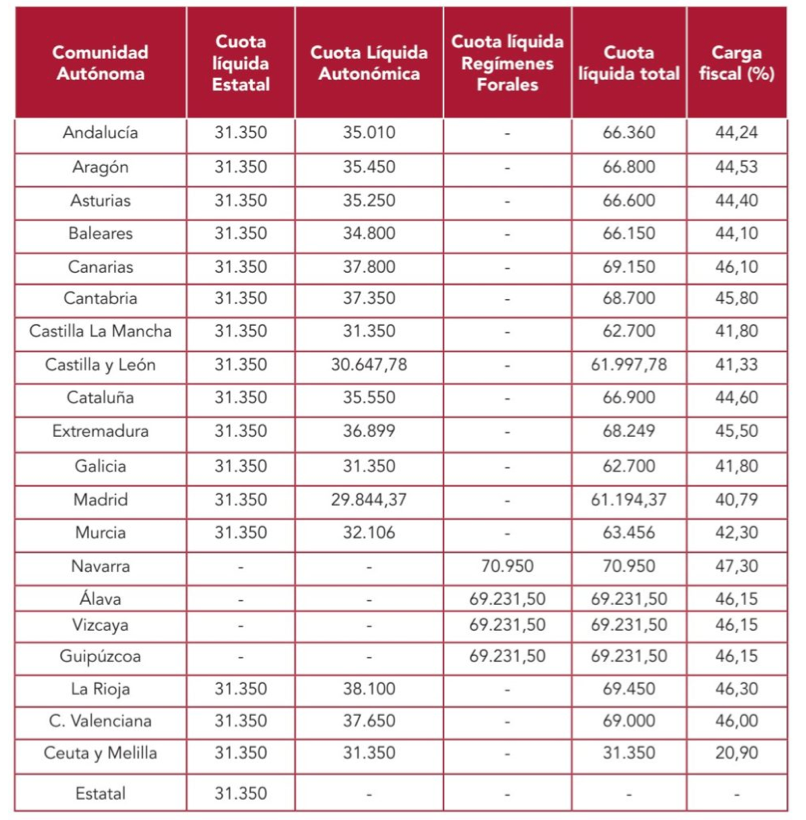
By regions, the tax effort of an income of 150,000 euros gross per year is specifies as follows:
Table 24. Effective types of personal income tax for an income of 150,000 euros gross per year
PART II FAMILY TAXATION IN THE FUTURE
- The tax effort in the years following the crisis
The long-term effect that Spaniards will suffer the most after the Covid-19 crisis is, without a doubt, the accumulation of public debt. According to the latest estimates published by the European Commission, the ratio of GDP can climb to 115.6%, which would mean adding 20.1 percentage points of GDP compared to the end of 2019.
Never before in history has there been such a vertical rise and in just one year, forcing the Treasury to intensify bond issues to a record high of 297 billion euros expected for 2020 in gross terms, resulting in a net issue of over 100,000 million (112,580 million euros from the estimate of the European Commission and the end of 2019).
Given this, the question seems obvious: how much of this new debt will become tax increases in the coming years? With the primary deficit forecast for the end of 2020 (-7.7%), an increase in the cost of financing debt (with a minimum of 2% of the average interest rate on outstanding debt) and the collapse of economic growth (-9.6%), a debt-to-GDP ratio of 115.6% is unsustainable in the medium term, requiring European aid to halt the explosive growth in debt.
Even assuming that European aid is broad and covers a substantial part of short-term financial needs, a State that drags public debt-to-GDP ratios of over 100% for a prolonged period ends up significantly affecting the productive structure and to the potential for economic growth. Furthermore, as Lord King (the former Governor of the Bank of England) said, the level of debt matters even in nominal terms, and not only the ratio of GDP. Each crisis starts with higher debt standards, and its sustainability increasingly depends on having a real interest rate artificially below its natural level.
In the case of Spain, this factor has been essential to slow the growth of debt over GDP, along with an expansionary phase of the economic cycle that has lasted 6 years, half of which has grown above 3% in real terms. The average interest rate of outstanding Spanish debt is close to 2%, while the economy closed 2019 with nominal growth almost one point higher.Not only the growth of the GDP or the cost of the debt determine the sustainability of the indebtedness. There is also a relationship between the volume of debt on GDP and potential growth. According to economists C. Checherita and P. Rother (2010) [15], when an economy exceeds a debt to GDP threshold of between 90% and 100%, potential growth is reduced by 0.64 points each year. The study by Professors Reinhart and Rogoff (2010) calibrates the impact on a loss of growth of 1% per year under the same scenario, with multiple negative effects on total factor productivity, interest rates, …
Therefore, the new debt generated will sooner or later become taxes that will fall on a weakened productive base with family incomes undermined by the crisis. To determine the amount of this greater fiscal effort, there are two approaches based on the historical series: one rests on the cost of the 2008-2013 crisis had on taxpayers’ pockets and the other on the tax-debt ratio public from the perspective of ‘Ricardian equivalence’.
Between 2008 and 2013, public debt increased by 592,000 million, with 2009 as the highest public deficit in the historical series to date, with 11.4% of GDP, and 2012, when the ransom was requested for the restructuring of the financial system. The years 2011 and 2012 are those with the highest net emission, coinciding with two of the worst years of the crisis. This dizzying increase in public liabilities led to a rise in taxes first in 2010 and 2011 and again in 2012, which was the largest in democracy.
Graph 15. Net Emission of Public Debt per Year
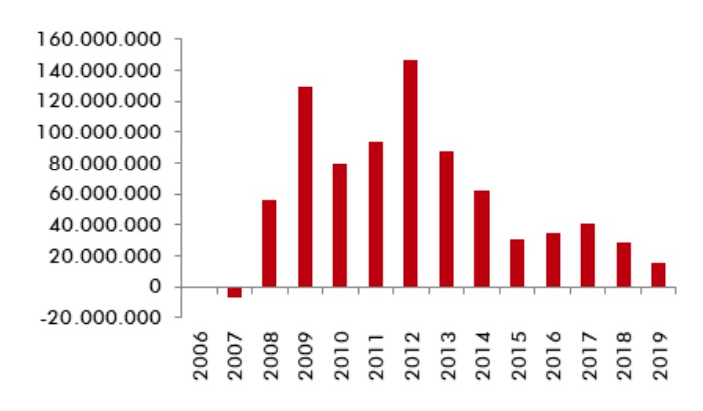
While the debt grew by almost 600,000 million, the tax bill increased for taxpayers in the midst of a recession by 22,000 million, yielding the highest number of days of salary necessary to pay taxes such as income tax, VAT and II.EE., among others. Therefore, the significant rise in taxes did not wait until the end of the crisis, which slowed down the recovery of the economy between 2012 and 2013 (Macías et al, 2014).
The other method to estimate the future cost of taxes derived from the increase in debt is to work with the principle of ‘Ricardian equivalence’ according to which, under a series of certain hypotheses, financing an increase in public spending via taxes in the present is equivalent to taxes in the future (debt).
Feldstein’s (1982) model brings us closer to how consumption, wealth and income move over time under the classical assumptions of fulfillment of the ‘Ricardian equivalence.’ According to Barro (1974), one of the conditions for it to be fulfilled is that the debt does not create net wealth, generating the same effect on consumption.
Applying the model to the Spanish case, together with the basic budgetary restriction of the Government, the direct effect of an increase of the total debt in 1,000 million generates in the following period an increase in taxes of 150 million euros. Therefore, given an expected rebound of 112,580 million, the fiscal cost may be increased by 17,326 million euros, which is equivalent, in per capita terms, to paying 365.52 euros more each year. Or, expressed in another way, 5 more days of salary, which would mean returning to the fiscal situation of before the 2015 reform.
In sum, it is reasonable to think that there may be early tax increases in the coming months for which taxpayers must prepare. We run the risk that the resources generated by families during confinement will go toward paying more taxes instead of contributing through investment to a way out of the coronavirus crisis.
2. Modification of the tax burden
In addition to a probable tax increase, the increase in public spending has already become a reality, together with a fall in household incomes. Taking the previous calculations of annual tax increase for 2020 and 2021, and based on the estimates of the European Commission, the following simulation of the evolution of the tax burden indicator is made:
Table 25. Scenarios of evolution of the tax burden indicator
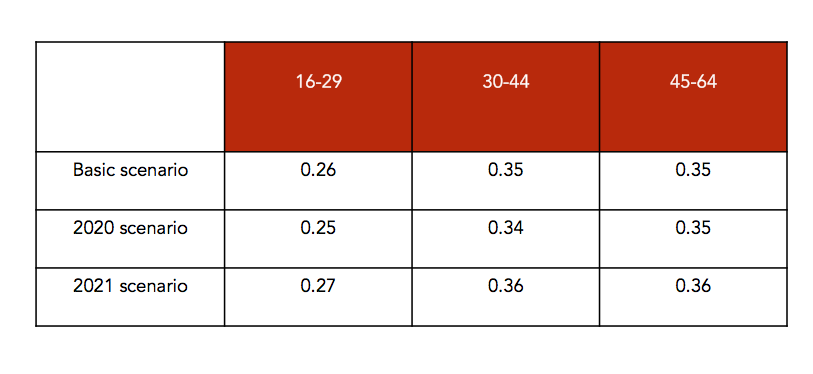
Between 2020 and 2021 the tax burden, far from decreasing, will continue to grow: by 2021, a taxpayer’s net contribution to the public sector will be 27% of net income, excluding the vital minimum, compared to 26% in early 2020. In this sense, the ‘profitability’ of paying taxes is diminished.
CONCLUSIONS
Throughout the study, we have been able to detail the actual payment of taxes, the social benefits obtained in exchange for said contribution to the State, the territorial distribution of tax burdens, and the scenarios that will open up after the health crisis. As phenomena such as longevity advance [16] and the costs of the crisis become chronic, the net benefits of the public system will decrease as the cost in terms of taxes increases.
Therefore, together with the need for reforms that boost the competitiveness and productivity of the Spanish economy, it is necessary to articulate complementary mechanisms that alleviate the tax burden on working life and prevent an inevitable loss of value of public services. In this sense, the balance between taxes paid and benefits received will improve if sufficient resources are obtained through other non-tax channels that do not harm the growth capacity of the Spanish economy.
This «new era» of taxation will not only be a «thing of the rich,” as it is often caricatured.The most direct taxation (IRPF and contributions) will not only fall on taxpayers but also on those who have availed themselves of income support measures such as ERTE (Temporary Employment Regulation Files) or the IMV, who will have have to make the personal income tax declaration next year, suffering the «fiscal punishment» that having two payers entails.
ANNEX I: THE EVOLUTION OF AVAILABLE INCOME AND THE COLLECTION OF THE MAIN TAXES
To analyze the evolution of the fiscal effort of families, it is necessary to examine the trajectory of family incomes which were especially affected by the 2008 economic crisis and which, at the end of the economic cycle, have managed to rise, but hace not reached the maximum of the first year of crisis (2009, data collected in 2010). Thus, they still carry the destruction of employment that was concentrated between 2009 and 2012, and the slow pace of growth in average wages during most of the expansionary phase of the cycle.
Graph 16. Average net income per person and by age group (in current euros with imputed rent)
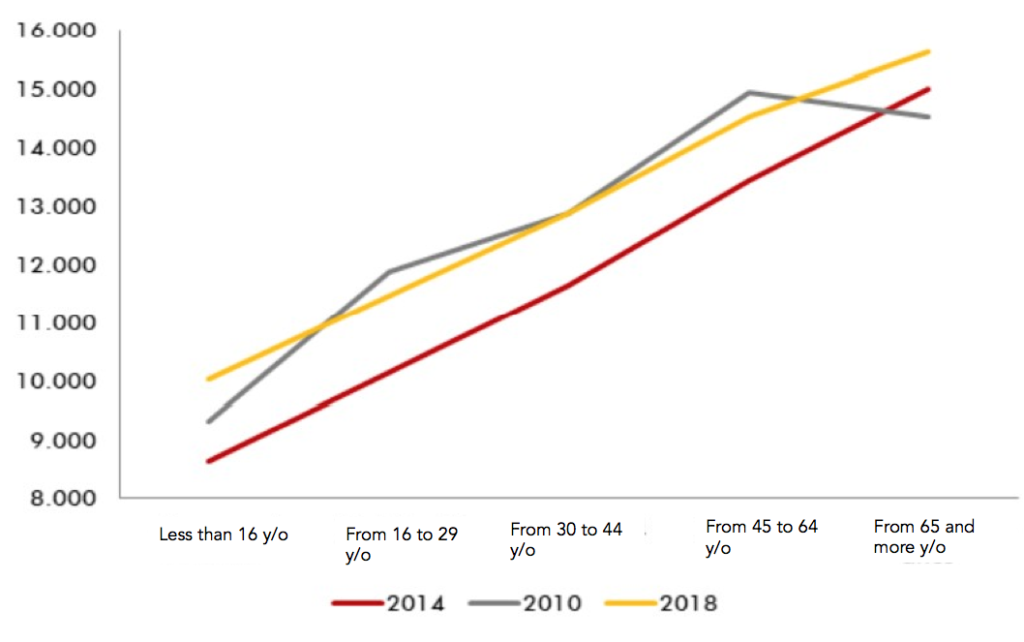
According to the most recent data, corresponding to 2018, the two extremes of the distribution are placed well above the 2010 level: + 7.74% and + 7.43%, respectively. Given that the population under the age of 16 generates income derived indirectly from the household to which they belong, the most significant figure is the increase in the income of retirees. However, families between the ages of 16 and 64 (known as the working-age population) have still not recovered their pre-crisis income levels today, with a reduction in their net income of around 2% .
This fall has strongly reduced the tax bases on which taxes are applied, especially in the case of labour income. This can be observed in Graph 16, where a clear shift in income distribution is shown towards lower levels until the last data, which improves every year without exceeding that of 2010 in the central age groups. Obviously, raising taxes while wages decrease would translate into a rebound in the tax effort that Spanish taxpayers bear.
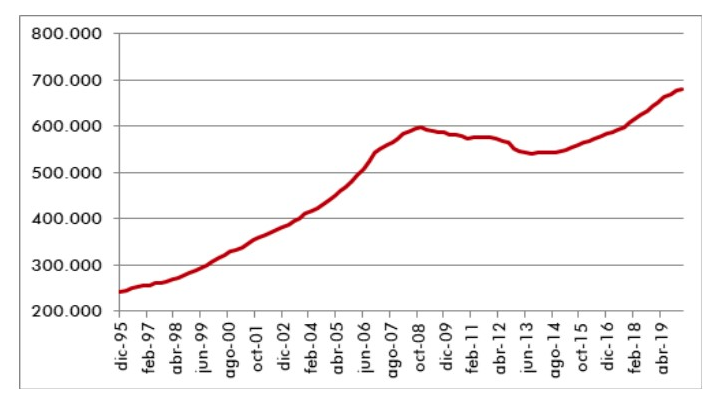
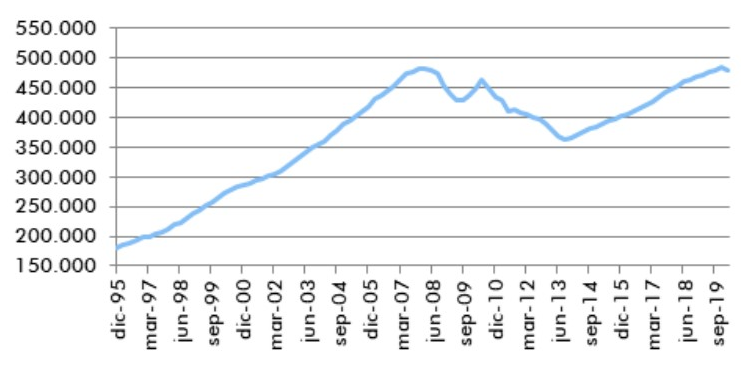
This is reflected in aggregate terms by the tax bases of personal income tax and corporation tax. For example, Personal Income tax grew from 490,000 to 590,000 million euros between 2006 and 2008, but in 2015 it did not reach 570,000 million and, in 2013, it fell below 550,000 million. With the latest data for the first quarter of 2020, it stands at 679,915 million nominal euros, a record high.
Graph 17. Evolution of the Personal Income Tax base (in million of euros)
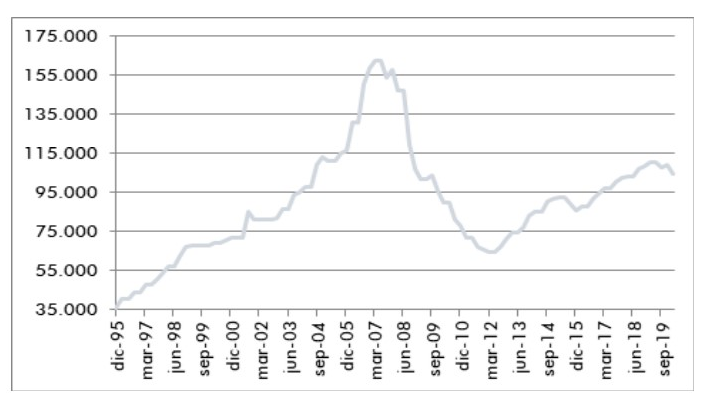
The Corporate Tax base reached 160,000 million euros before the crisis, but now it is moving slightly above 100,000 million euros, a decrease even more significant than that registered by Personal Income Tax. In 2019, in the middle of the year, it marked its relative maximum in the bullish phase of the cycle. Since then, it has started to decline in line with the profits of national companies.
Graph 18. Evolution of the corporate tax base (in millions of euros)
Graph 19. Evolution of the VAT tax base (in millions of euros)
Graph 20. Evolution of the tax base of Special Taxes (in millions of euros)
The VAT provides a similar scenario. The peak approached 490,000 million euros, while the valley was below 370,000 million. Currently, the tax base exceeds 477.9 billion.
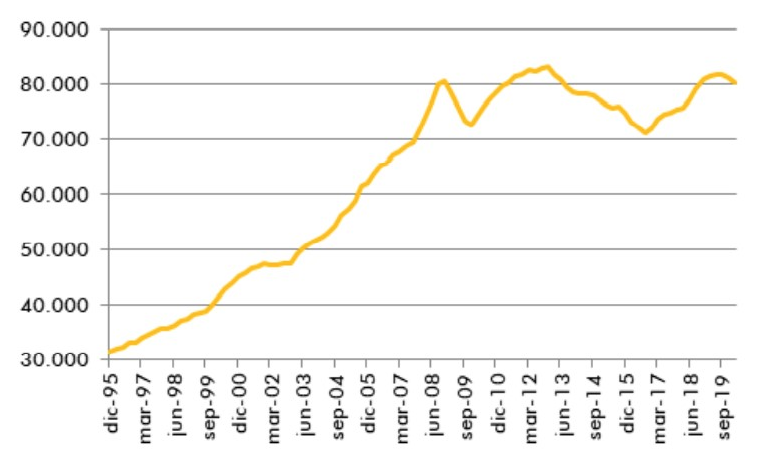
In the case of the II.EE., its tax base peaked between 2012 and 2013, exceeding 80,000 million euros. Today, it borders on that line. With the latest provisional Tax Collection data for March 2020, it is clear that the collection is, in nominal terms, close to the maximums of the historical series, as is the case with Personal Income tax.
In summary, taxes (including the slower recovery of Corporation Tax) have substantially improved revenues in recent years, reaching historic collection levels. However, the end of the cycle is already being noticed and, therefore, «advanced» taxes such as VAT, II.EE. or Corporation Tax warn of the drop in tax collection for cyclical reasons. In the coming months, it will be possible to gauge to what extent the coronavirus crisiswill effect the rest of the year, which points to a decrease of 30%.
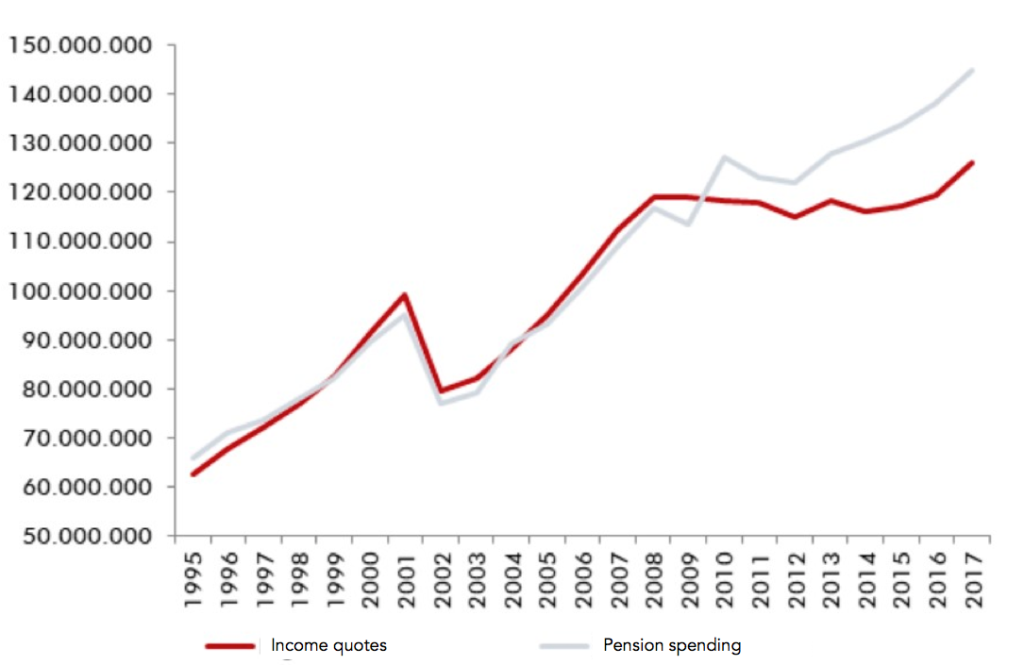
Finally, the increase in public income in the main taxes can also be found in the Social Security accounts. Tax collection before the crisis grew to 5.5% year-to-year, taking off after almost ten years of stagnation below 120,000 million euros. It is tax that collects the most in Spain to meet pension commitments, which grow above 4% year-to-year.
Graph 21. Evolution of the collection of contributions and pension expenses (in thousands of euros)
ANNEX II: THE «CHEAT» OF NOT DEFLATING THE PERSONAL INCOME TAX RATES
One of the basic tax principles is the ability to pay, where the taxpayer pays taxes based on their ability to generate income. However, this can be altered by the phenomenon of inflation.
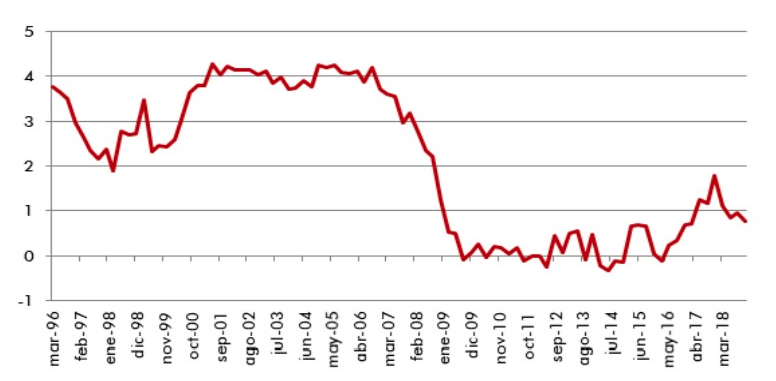
Graph 22. Evolution of the GDP Deflator (year-to-year rate of change), at market prices and adjusted for seasonality
To correct this effect, the revised text of the Personal Income Tax Law contemplates the deflation of Personal Income tax rates. Despite the legal mandate, the Tax Agency has not applied these corrections since 2008, except in the case of the Provincial Treasuries of Navarra and the Basque Country. Inflation is still a “shadow” tax that also affects taxpayers asymmetrically and regressively. Younger age groups suffer its incidence more significantly, but it affects all generations.
If we relate the deflated tax base to the rates that have been applied, we see that the effort in personal income tax has been “inflated” by 6.43% since 2008. And, despite the fact that prices fell slightly in the fiscal years 2013 and 2014, the accumulated inflation since the outbreak of the crisis has reduced the purchasing power of the Spanish by 6.43 percentage points.
For an average salary income (a representative worker in a family unit and with a child older than 6 years, at the midpoint of maturity of their professional career), not deflating the income tax rates translates into five more days of gross salary delivered to the State.
In monetary terms, we are talking about an additional payment of 430 euros. Therefore, in lost wages, Tax Freedom Day should have arrived on 23 and not on June 27 if the Personal Income tax had been updated according to the increase in prices observed during the crisis.
To calculate how many days of salary are needed to pay all taxes and social contributions, we use four different models of person depending on the population cohort in which they fall: 16 to 29 years, 30 to 44 years, 45 to 64 years, and over 65 years. Then, taking the average gross wages by cohort given by the INE Salary Structure Survey, the “tax wedge” that relates direct taxes to labor cost is calculated first.
This exercise is repeated in 3 cases: taxpayer without children, taxpayer with one child and family unit with 2 children. In this way, it is analyzed how the “tax wedge” changes both in the transition between the 3 family models and also with respect to the marginal rate of personal income tax (how much additional taxation are introduced by social contributions?), And in the comparison at the OECD level .
Once the direct taxation on income from work has been analysed, and following the methodology of the “Tax Freedom Day,” the rest of the taxes such as VAT, II.EE., wealth taxes, autonomous and municipal taxes are considered. Note that rates, public prices and special contributions are not taken into account, since their effect is marginal and would introduce enormous confusion, since they are not imposed and have a large territorial dispersion, which is beyond the scope of this study.
The calculation of VAT and II.EE. is given by the consumption pattern based on the age of the INE’s Continuous Survey of Family Budgets in its latest update, corresponding to 2018. This, added to the work of Garry et al, allows for the obtaining of the VAT expense per household (2.5 people per household according to the INE) and spending on II.EE. by household, broken down into its different items, such as electricity, fuels …
Finally, the taxpayer model is completed with his wealth profile, which, depending on age, is characterised by data from the Bank of Spain’s Financial Survey of Families in its latest update (2017). This leads to the payment calculations for IBI, Patrimony, Successions and Donations and ITP and AJD.
Finally, to quantify the number of days of labour cost necessary to satisfy taxes, all the taxes paid are added together in relation to the labour cost, multiplied by 366 for this year as it is a leap year, and by 365 in a «normal» year.
In the analysis by regions, the differences are established based on the regional income tax bracket (partially transferred tax), the fully transferred taxes (Heritage, Successions, ITP …) and the municipal taxes (IBI, Registration …) currently in force. All this is in accordance, as previously noted, with the consumption, income and wealth pattern of each family and depending on the territory and age.
[1] Serraller, M. (2020, 31 mayo). Alberto Garzón: “El impuesto a las fortunas no será suficiente para todo el gasto previsto”. Expansión. Retrieved from: https://www.expansion.com/economia/politica/2020/05/31/5ed41f1fe5fdea38078b45f3.html
[2] Roncella, L. y Roncella, A. (2020, 22 abril). ¿Ingreso Mínimo Vital para la crisis del coronavirus? Artículo Investigación Civismo 05/2020. Retrieved from: https://civismo.org/es/un-ingreso-minimo-vital-para-la-crisis-del-coronavirus/
[3] Santacruz, J. (2020, 19 de abril). “El ingreso mínimo es una mala idea”. La Razón. Arranz, R. (2020, 12 de abril). “José Antonio Herce: El IMV es un error, una invitación a no trabajar”. Vozpópuli. Retrieved from: https://www.vozpopuli.com/economia-y-finanzas/Jose-Antonio-Herce-invitacion-trabajar_0_1344765983.html. Alonso, C. (2020, 30 de mayo). “Las grietas de la renta mínima: del pobre al trabajador en B que se apunta al paro”. La información. Retrieved from: https://www.lainformacion.com/economianegocios-y-finanzas/ingreso-minimo-vital-economia-sumergida/6571261/ y Velarde, G. (2020, 13 de junio). “La renta mínima amenaza con endosar un 5% más de paro al desincentivar el trabajo”. El Economista. Retrieved from: https://www.eleconomista.es/economia/noticias/10603224/06/20/3/La-renta-minima-amenazacon-endosar-un-5-mas-de-paro-al-desincentivar-el-trabajo.html
[4] Methodology developed on Tax Freedom Day 2018
[5] 39,1% del PIB en España frente al 46,5% de la media de la Eurozona. Eurostat. Retrieved from: https://appsso.eurostat.ec.europa.eu/nui/submitViewTableAction.do
[6] The last data available are from INE’s 2018 «Encuesta de Estructura Salarial». You can find the original data here: https://www.ine.es/dyngs/INEbase/es/operacion.htm?c=Estadistica_C&cid=1254736177025&menu=resultados&idp=1254735976596.
[7] Personal Income Tax at a national level:
| Taxable Base | Personal Income Tax |
| Up to 12.450 | 19,00% |
| Following 7.750 | 24,00% |
| Following 15.000 | 30,00% |
| Following 24.800 | 37,00% |
| From 60.000 onwards | 45,00% |
[8] The contribution bases are computed in 12 payments.
[9] Garry Chuan, K. y Pijoan-Mas, J. (2014, 15 de julio). El IVA 2013: recaudación y progresividad. Nada es gratis. Retrieved from: https://nadaesgratis.es/josep-pijoan-mas/el-iva-2013-recaudacion-yprogresividad
[10] García Ciria, C. y D. López-Rodríguez (2018): “Estructura impositiva de España en el contexto de la Unión Europea”, Documentos Ocasionales Nº 1810, Banco de España.
[11] Banco de España (2019). Encuesta Financiera de las Familias (EFF) 2017: Métodos, Resultados y Cambios desde 2014. Artículos Analíticos 04/2019, Boletín Económico.
[12] Santacruz, J. (2018, 27 de junio). Día de la Liberación Fiscal 2018. Informe de Civismo. Retrieved from: https://civismo.org/es/dia-de-la-liberacion-fiscal-2018/
[13] La Ley de Medidas Fiscales se aprobó el 30 de abril con efectos retroactivos al 1 de enero de 2020: https://portaldogc.gencat.cat/utilsEADOP/PDF/8124/1793083.pdf
[14] Una guía útil e imprescindible cada año para vigilar las novedades tributarias en los principales impuestos cedidos total o parcialmente a las autonomías es el informe del REAF denominado “Panorama de la Fiscalidad Autonómica y Foral 2020”.
[15] Checherita, C. y Rother, P. (2010). The Impact Of High And Growing Government Debt On Economic Growth: An Empirical Investigation For The Euro Area. Banco Central Europeo.
[16] Santacruz Cano, J. (2017): Longevidad y Cambios en el Ahorro y la Inversión. Documento Foro de Temas de Inversión Nº 2, Fundación de Estudios Financieros.