1. INTRODUCTION. STATE COSTS AND BENEFITS
In 2019, the Spanish economy is deepening in the deceleration phase of the economic cycle initiated at the end of 2017. To this is added a calendar full of electoral commitments, in which the future of fiscal policy is played and, what is more importantly, the arsenal of economic policy measures to face the next recession. The depletion of the economic cycle is evident, although decisions have been made and there are negative expectations that contribute to accelerating the economic contraction, as can be seen, for example, in the Italian case.
Given the combination of appointments with the polls and the economic momentum, it is of special relevance to reveal to the citizen the impact that the public sector has on his life, his wealth, and his economic and social decisions, particularly from the field of taxation. This, however, cannot be understood without evaluating the intervention of the State as a whole, that is, by means of public spending and the provision of goods and services of general interest. Therefore, it is necessary to talk about taxation by comparing its effect with that generated by the action of public services such as healthcare, education or pensions, among others [1].
In 2018, Civismo carried out the first study in Spain of these characteristics: compare how much a taxpayer pays and how much he receives from the State based on his personal, family, regional, and other circumstances that are defined by disposable income, job offers or productivity. In 2019, the objective is not only to update and keep in mind the balance between costs and benefits of the State, but also to put it into perspective when examining the economic status of the person (especially, salary) and the family.
This edition of the Tax Freedom Day will attempt to answer the following questions: How much taxes do we pay throughout our lives? How does the tax burden change according to our age? What effort do families take to comply with the Treasury? Is Spain well off compared to other developed economies? What is the economic value of public services? What direct and indirect benefit does a taxpayer receive through public spending?
This report is structured in two parts: in the first one, the questions related to taxation are answered, and in the second, public spending is addressed and what variables determine that it is profitable for a taxpayer to pay taxes and sustain the Welfare State. Finally, there is included an appendix on taxation and public expenditure by the Autonomous Communities.
This study is based on the consideration of the two taxes that collect the most in Spain: social contributions and the Personal Income Tax. The latter has undergone numerous modifications in the last ten years, mainly with three tax reforms approved in 2009, 2011 and 2015. The first two resulted in rate increases, while the third left some tax relief, with decreases of tax rates and extensions in the minimum exempt and deductions.
Between 2018 and 2019, there has been a turning point in terms of fiscal pressure. The Ministry of Finance has put the emphasis on growing in a more meaningful way both the tax bases and the collection of the main taxes, coming to propose tax increases. Despite the growth rates of the Spanish economy, taxation still acts within a framework of slow recovery of family income, undermined in the years of economic crisis. Thus, they still drag the destruction of employment that was concentrated between 2009 and 2012, and the moderate fall in average wages in recent years.
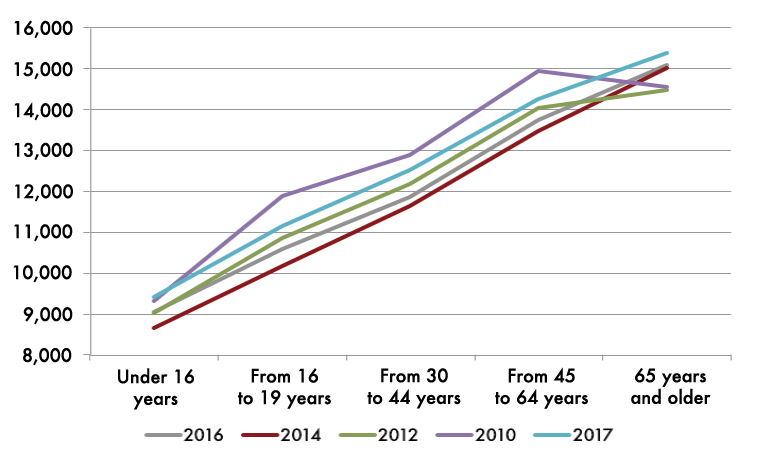
With the most recent data, corresponding to 2017, the only population cohort that has not lost disposable income since 2010 has been that of retirees (+ 5.72 percent). However, families between the ages of 16 and 64 (what we know as working-age population) have not yet recovered pre-crisis income levels, with a reduction in their income around 6 percent.
This fall has greatly reduced the tax bases on which taxes are applied, especially in the case of labour income. This can be seen in Graph 1, which shows a clear shift in the distribution of income to lower levels, until the last data, which improves that of all previous years but without exceeding that of 2010.
Graph 1. Recovery of disposable income. Average monthly gross income by age groups (in current euros).
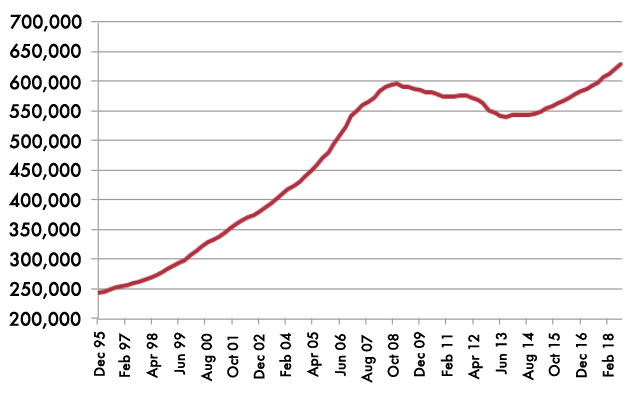
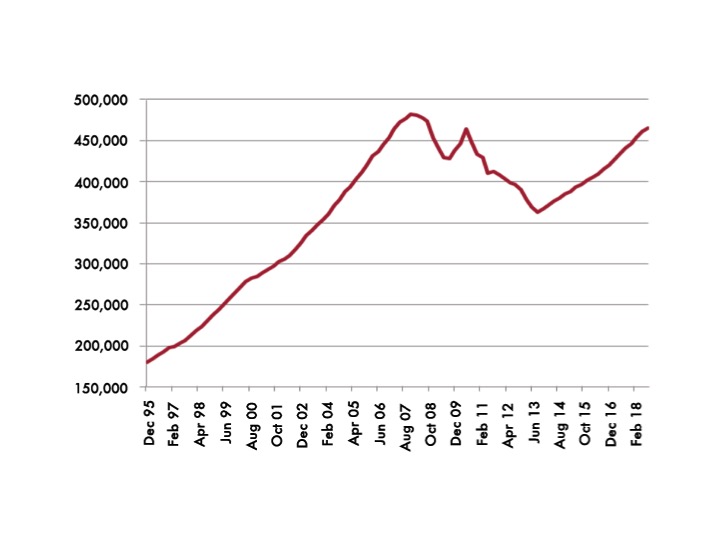
Obviously, raising taxes while wages are reduced would result in a rebound in the fiscal effort that Spanish taxpayers bear. This is reflected in aggregate terms the tax bases of the Personal Income Tax and Corporate Tax. For example, income tax grew from 490,000 to 590,000 million euros between 2006 and 2008, but in 2015 it did not reach 570,000 million and, in 2013, it reached below 550,000 million. With the last data of 2018, corresponding to the third quarter, it stands at 629,000 million nominal euros; an all time high.
Graph 2. Evolution of the income tax base (in millions of euros).
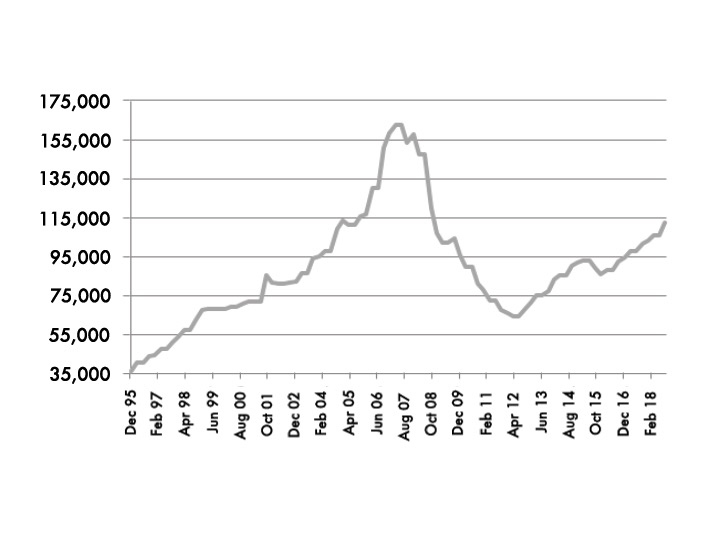
In the case of Corporate Tax, its tax base reached 160,000 million euros before the crisis, but now it moves slightly above 100,000 million euros, an even more significant decrease than that recorded by the IRPF.
However, it is recovering gradually, as the benefits of national companies are growing, largely thanks to the contribution of large multinationals based in Spain, and taking into account the fiscal effects of the measures approved in July 2017, which raised tax payments on account.
Graph 3. Evolution of the corporate tax base (in millions of euros).
On the other hand, if we pay attention to the VAT, we also find a similar scenario. The peak came close to 490,000 million euros, while the valley was below 370,000 million. Currently, the tax base exceeds 450,000 million. If at this moment there is an engine in the Spanish economy, that is undoubtedly consumption.
Graph 4. Evolution of the VAT tax base (in millions of euros).
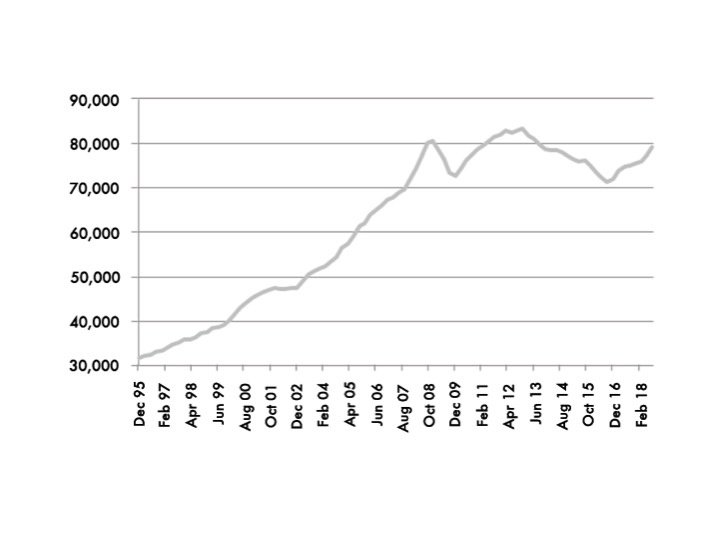
As for Special Taxes, its tax base hit a ceiling between 2012 and 2013, exceeding the 80,000 million euros barrier. At present, it is about the same amount. With the latest provisional tax collection data, of September 2018, it can be seen how the collection is in nominal terms close to the maximums of the historical series, as it happens with the personal income tax.
Graph 5. Evolution of the tax base of Special Taxes (in millions of euros).
In summary, except for the somewhat slower improvement of Corporation Tax, the rest of the taxes have substantially increased tax revenues in the last year, reaching historical levels of collection. In this sense, it grows above nominal GDP (+ 6.5 percent annually compared to 4 percent).
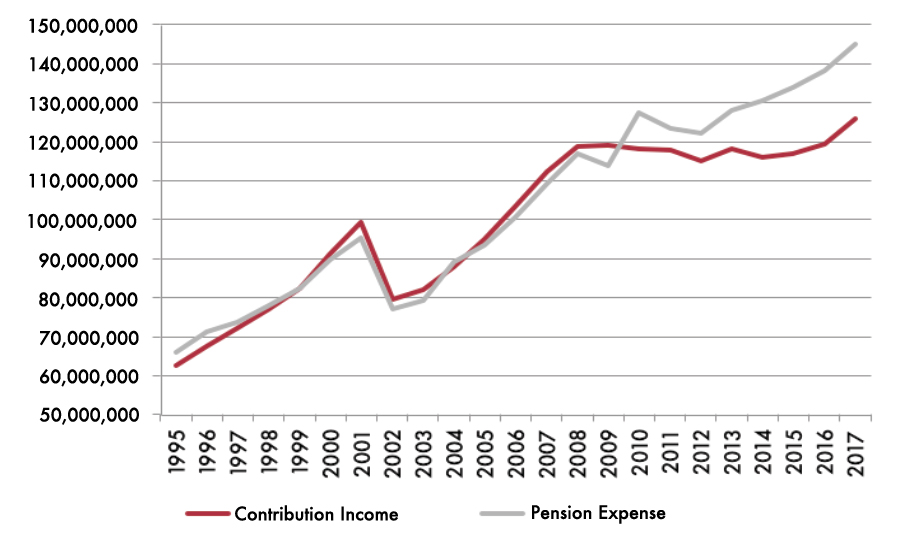
Finally, this increase in public revenues from the main taxes can also be found in the Social Security accounts. Collection by contributions is growing at 5.5 percent annually. That is, it is taking off after almost ten years of stagnation below 120,000 million euros. This is the tax that collects most in Spain, intended to meet pension commitments. These increase above 3 percent every year, under a deficit of 18.8 billion euros, an all time high.
Graph 6. Evolution of the collection by contributions and expenditure in pensions (in thousands of euros).
3. WHAT “TAX WEDGE” DO WORKERS HAVE?
If we analyse the evolution of the tax bases of the personal income tax and also consider the changes in the number of contributors, we can quantify what is the real weight of taxes on labour in Spain. This indicator is known as «tax wedge».
Since 2016, the Tax Freedom Day report collects calculations adjusted to the different situations of taxpayers according to their age group. As income levels experience variations throughout our lives, these fluctuations must be taken into account to obtain conclusions closer to reality.
Following the methodology developed in the previous editions, and in accordance with the data of the National Statistics Institute (INE in Spanish) on the wage deciles of the main employment and the Salary Structure Survey, the employed population in Spain is divided into three main sections:
- Deciles 1, 2 and 3 are the low incomes. They consist of those wage earners who earn less than 1,221.10 euros gross per month. They are 30 percent of the population with employment.
- Deciles 4, 5, 6 and 7 are the average incomes. This group includes employees with incomes of between 1,221.11 and 2,173.50 gross euros per month. They represent 40 percent of the employed population.
- Deciles 8, 9 and 10 are high incomes; that is those who make more than 2,173.51 euros. This group represents the remaining 30 percent of the employed population.
From this salary distribution, we will group the population into four large age groups —also known as cohorts. The sections chosen include from 16 to 29 years old, from 30 to 44 years old, from 45 to 64 years old, and over 65 years old. For each of these generations of workers, we will assign the corresponding average gross salary, according to the average household income data reflected in the Salary Structure Survey [2].
Initially, we apply the calculation of the «tax wedge» to the assumption of a taxpayer who has no family burdens. This way, we arrive at a first representative estimate. In the next chapter, the scope of income taxes among families is detailed, both with one child and two.
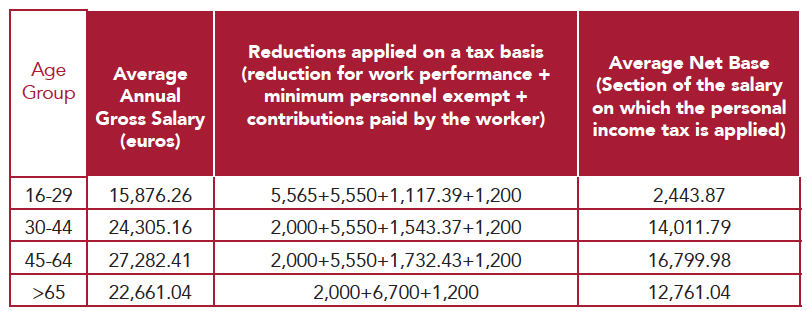
Table 1. Average net base of personal income tax
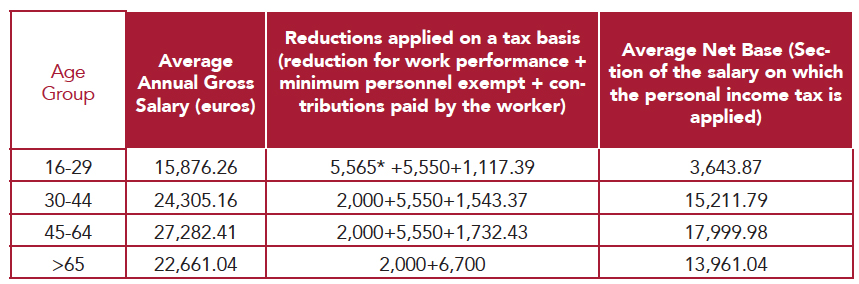
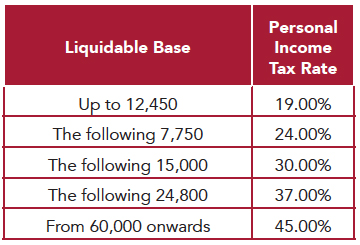
As established by the tax legislation born of the tax reform of 2015, and taking into account the changes introduced in the General State Budgets for 2018, the calculation of the liquidable base contains different reductions in base. On the one hand, there are the deductible expenses of 2,000 euros in general, together with the reduction in income when these are less than 16,825 euros.
On the other hand, the “personal minimum exempt” to pay income tax, currently set at 5,550 euros and increased for those over 65 years. In addition, the social contributions paid by the worker and listed as a deductible expense are also counted in order to avoid double taxation, up to a maximum of 2,486 euros per year.
Before continuing with the quantification of the “tax wedge”, one must stop at one of the most important legislative measures of 2018: the rise in the minimum wage by 22.3 percent. This has meant a symmetrical increase in the minimum contribution base, which is for the first time above 1,000 euros. It implies, therefore, an extraordinary increase in the hiring of people with lower salaries and productivity, lower professional qualification and, above all, of those cohorts that are entering the labour market or have been in it for a few years: young people.
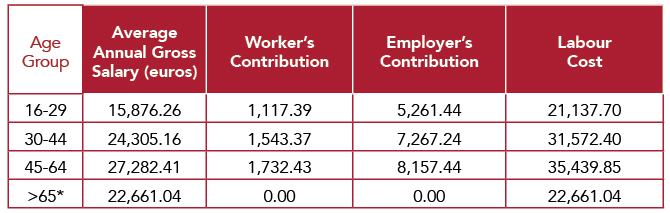
Thus, the labour cost of a newly graduated young person has come, as of January 2019, from 5,216.08 euros (4,302.37 euros of employer’s contribution and 913.71 euros from that of the worker) to 6,378.84 euros (5,261 , 44 euros of employer’s contribution and 1,117.39 euros of that of the worker). That is, 1,162.76 euros more per year, which have resulted in an automatic decrease in net salary of 203.67 euros. Later, when making the calculations of the tax set, it will be seen how this measure has led to a very relevant fiscal increase. Therefore, it has a significant impact on the number of salary days to pay taxes in 2019.
So far, we have verified the impact of personal income tax and social contributions on the payroll, more direct. However, as we pointed out in the first chapter of the report, it is necessary to take into account the contribution that the company assumes for the benefit of the employee, and that hides the gross labour cost of each job. This calculation is reflected in the following table.
Table 2. Social Contributions and Gross Labour Cost
Once calculated the bases that apply in personal income tax and social contributions, the same is done with the tax pressure of labour costs. First, in terms of personal income tax on current rates:
Over the last year there have been no changes in the tax rates, but in some installments and deductions in installment that we will analyse later at the regional level. From all this, we determine the «tax wedge», that is, the real weight of taxes on work in Spain, on average, before applying the regional scales. The result is:
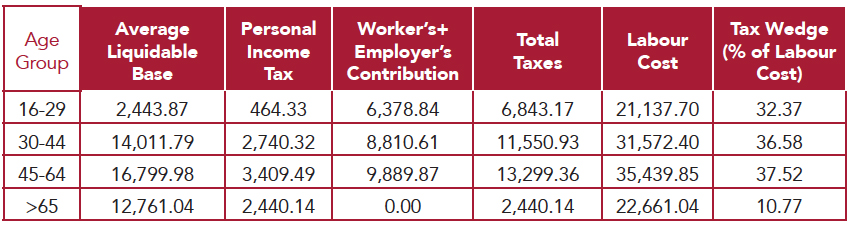
Table 3. Income tax wedge in Spain for 2019
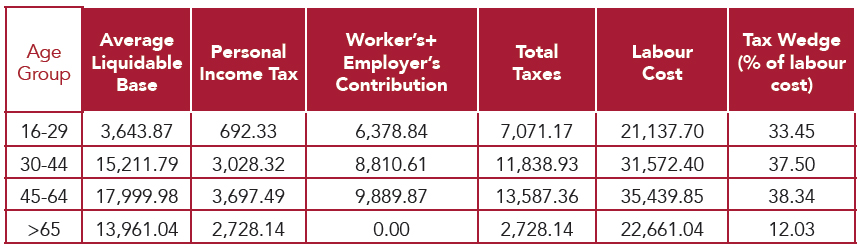
This means that young people between 16 and 29 years old charge 66.55 euros for every 100 euros of labour cost, due to a “tax wedge” of 33.45 percent.
For workers aged 30 to 44, income tax and social security contributions assume that every 100 euros paid per company and worker remain at 62.50 euros of effective compensation, which is equivalent to a «tax wedge» of 37.50 percent.
Those employed between 45 and 64 years (average age of the population) retain only 61.66 euros of every 100 euros paid by the company to employ them, which is equivalent to a “tax wedge” of 38.34 percent.
Finally, among those over 65 years of age, direct taxation means that, of every 100 euros, approximately 88 are collected effectively. In this case, the «tax wedge» reaches 12.03 percent, given the absence of tax pressure from social contributions.
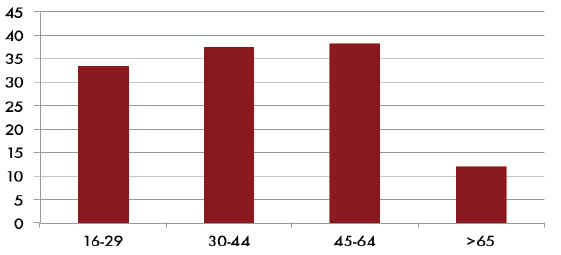
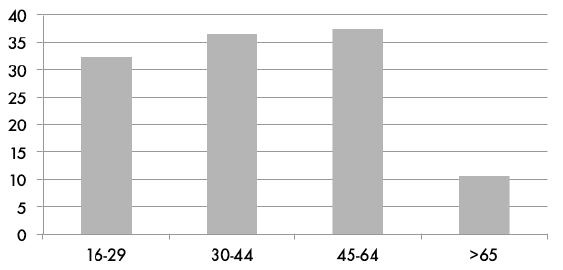
Graph 7. “Tax wedge” (%) for a taxpayer without children, by age group (in percentage of labour cost)
4. TAXATION OF FAMILIES
So far we have started from an assumption in which the taxpayer has no family; that is, he is neither married nor any has children. Now comes the time to calculate the «tax wedge» faced by Spanish households with one or two descendants. First, we quantify the average taxable income tax base for a taxpayer (head of a household) with a child:
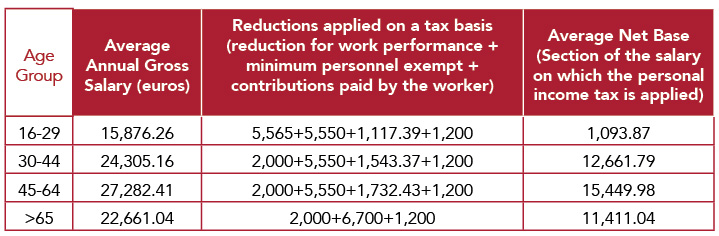
Table 4. Families with a child. Average net income tax base
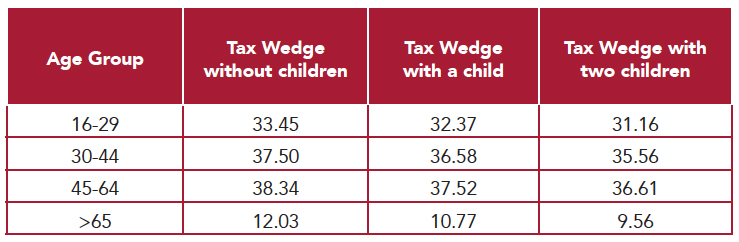
From these data, we can determine the «tax wedge» that Spanish families with a child bear, taking into account that a descendant —who lives with parents and does not receive income— deducts until he turns 25. The result, reflected in table 5 , yields tax levels ranging from 32.37 percent to 37.52 percent in the working-age population.
In this sense, a son “softens”, on average, a percentage point “tax wedge” among taxpayers aged 16 to 64 years. Despite the effect of personal income tax, social contributions do not discriminate on family charges, which distorts family planning and the incentives that income tax introduces for having children.
Table 5. “Tax wedge” for families with a child
Graph 8. “Tax wedge” for families with a child (%)
And what about families with two children? To obtain this information, it is necessary to first calculate the average taxable income base of the personal income tax, and then determine the scope of the labour taxes in monetary and percentage terms. The result is reflected in the following table:
Table 6. Families with two children. Average net income tax base
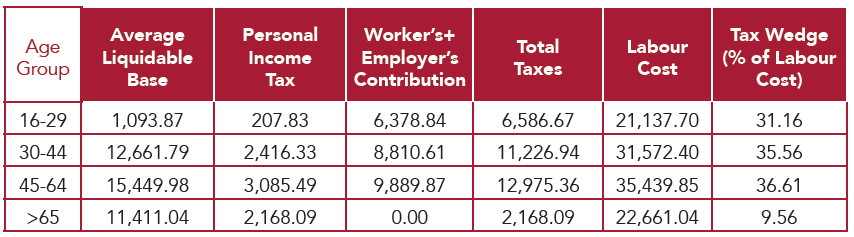
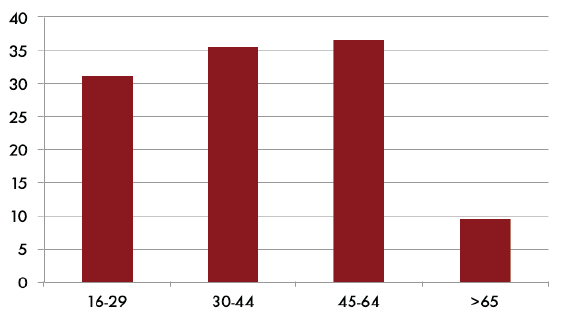
Next, we estimate the “tax wedge” of families with two children. As the following table reflects, this indicator ranges from 31.16 percent to 36.61 percent in the working-age population. Thus, having a second child lowers, on average, more than one percentage point in each population cohort.
But even more striking is the effect it produces on families with members of over 65 years of age. With a country that ages rapidly, the tax system on labor income (income tax + social security contributions) grants a greater tax reduction for having children in the case of mature parents than younger parents. Specifically, in the case of a family in the age cohort of more than 65 years with two dependent children, the reduction in “tax wedge” with respect to the one with only one amounts to practically 1.2 percent, while in the average population cohort (45-64 years) this reduction would be only 0.82 percent.
Therefore, the taxation of income generates the opposite incentive to that sought by economic policy. Despite the process of demographic ageing and the need for policies that stimulate birth, the tax system, instead of providing proportional incentives to younger families, rewards having children at a later stage in life.
Table 7. “Tax wedge” for families with two children
Graph 9. “Tax wedge” for families with two children (%)
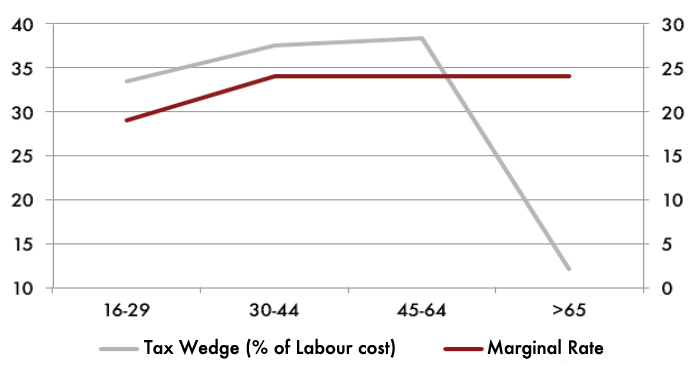
The progressiveness of the «tax wedge» among families is distributed as follows:
Graph 10. Progressiveness of the “tax wedge” for a taxpayer without children
Graph 11. Progressiveness of the “tax wedge” for a taxpayer with one child
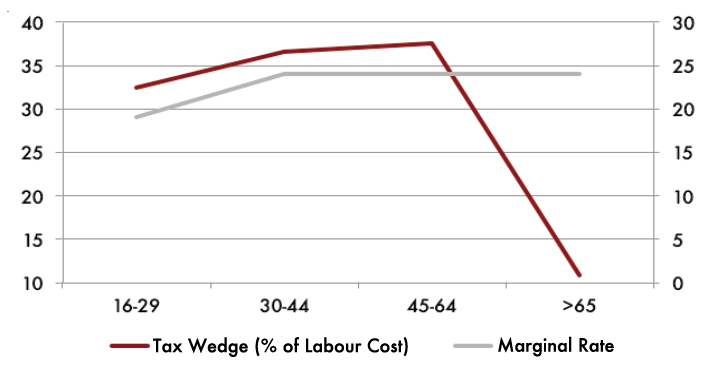
Graph 12. Progressiveness of the “tax wedge” for a taxpayer with two children
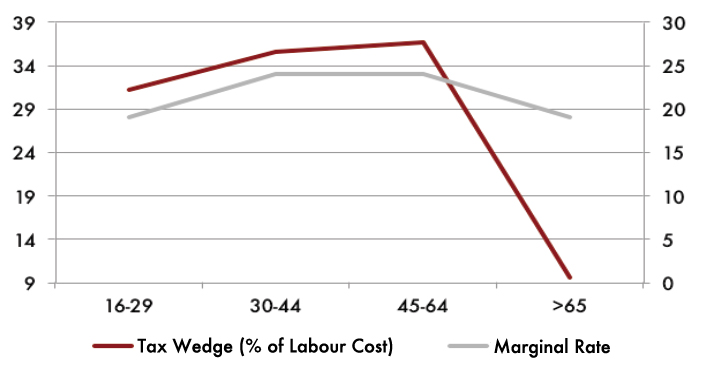
Table 8. Summary of «tax wedges» for families
The previous graphs show that the progressiveness of the system loads an additional differential effort between the average and low incomes. Social security contributions represent the bulk of the «tax wedge» and explain that, despite the different types of personal income tax, there are no very pronounced differences when we estimate the real weight of taxes according to age groups and income level.
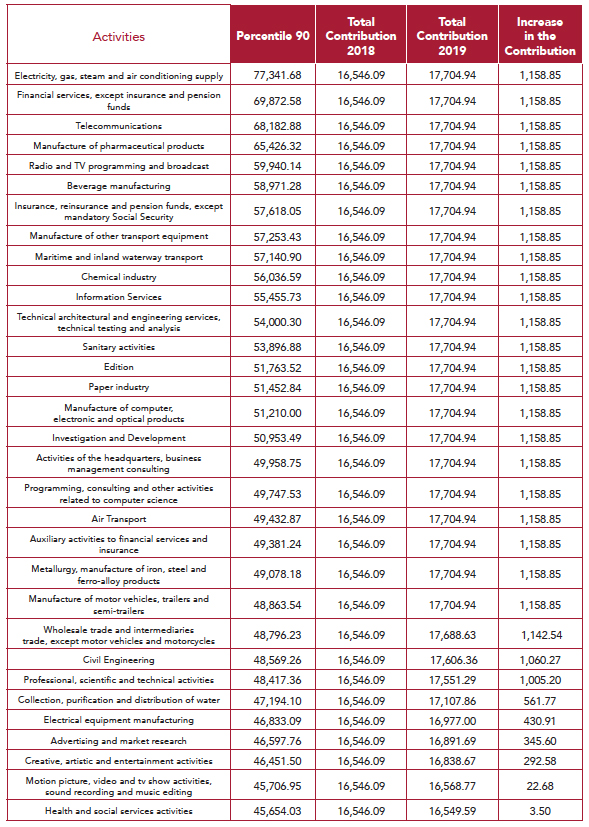
In this matter, not only do the rates set in the social contributions matter, but also the minimums and maximums of their bases need to be addressed, especially after the aforementioned entry into force in 2019 of the new Minimum Wage; fixed at 900 euros, 22.3 percent more than in 2018. A graduated employee has a minimum in its social security contribution base of 1,466.40 euros (22.3 percent more than in 2019), while the maximum for all professional categories it is 4,070.10 euros (7 percent more). Consequently, a gross salary of more than 48,841.20 euros per year in 12 payments [3] (total labour cost of 63,444.71 euros) has a fixed fee of 17,704.94 euros per year, together with the employer’s quota and the one that is charged to the worker.
Table 9. Effects of the rise of the maximum social security contribution base (2019)
In the population distribution by cohorts, the average individual of each age group is within the previous maximum and minimum. However, the sub-distributions of each of the age groups show a small number of taxpayers that do exceed the maximum limit and in which, therefore, progressiveness is considerably reduced. A good part of them are senior officials who contribute to a private system, or managers who have private social insurance that do not depend on the public Social Security system.
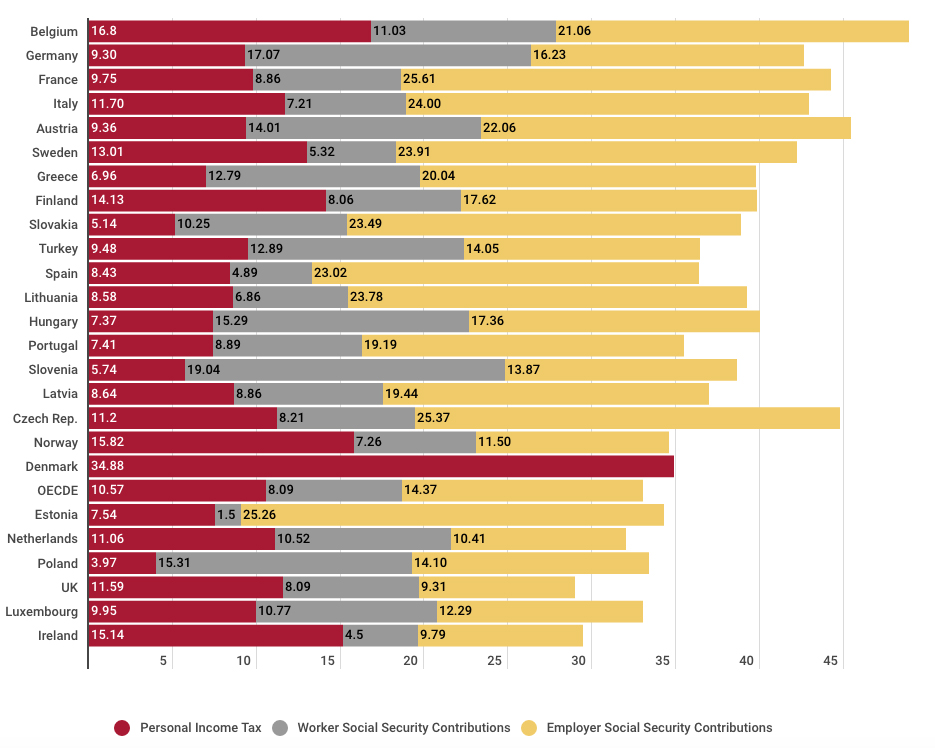
5. THE ‘TAX WEDGE’ IN THE WORLD
The «tax wedge» that the Spanish taxpayer supports is among the highest in developed countries. This is credited by Taxing Wages, the annual report published by the OECD on labour taxes. According to this study, the “tax wedge” (calculating a gross average salary without applying personal minimum in the taxpayer without children and applying the minimums by descendants) is 3.3 percent higher in Spain than in the average of the economies developed: 39.25 percent in our case for 2017; 35.92 percent in the OECD average. In the case of the taxpayer with two children, the total tax pressure on the salary is reduced in Spain to 33.72 percent compared to 26.12 percent of the OECD average, which implies lowering a position with respect to 2016 in the ranking of countries with the highest taxation on labour.
The following graph allows us to check in a more visual way the comparative disadvantage suffered by taxpayers in our country:
Graph 13. “Tax wedge” in the OECD for a taxpayer without children (%)
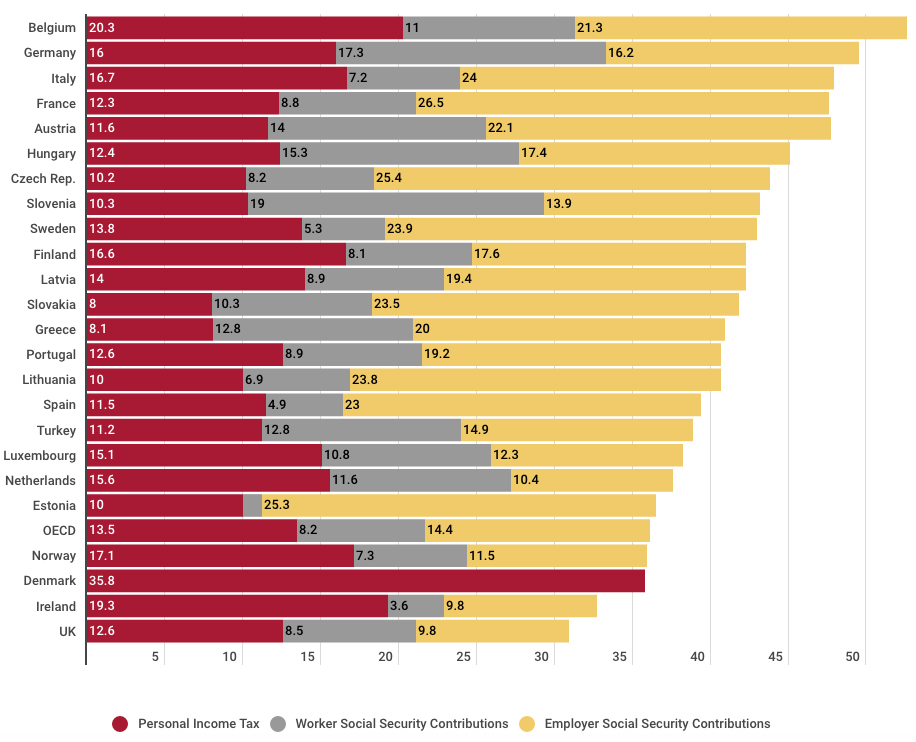
Only 15 of the 34 developed economies which are OECD members have a “tax wedge” higher than that of Spain, which means that the remaining 19 have lower taxes. The myth that Spain is a country of low taxes is therefore not supported.
At least, the tax effort assumed by the income of the work has been reduced between 2015 and 2019, so that an individual and childless taxpayer now pays 1.4 percent less than before the tax decrease approved in 2015.
Graph 14. “Tax wedge” in the OECD for a taxpayer with two children (%)
At least, the tax effort assumed by incomes has been reduced between 2015 and 2019, so that an individual and childless taxpayer now pays 1.4 percent less than before the tax reduction approved in 2015.6
6. THE IMPACT OF VAT ON OUR POCKETS
In addition to labour taxes, the Spanish taxpayer also bears the systematic payment of a battery of indirect taxes, among which the Value Added Tax (VAT) stands out. This tax has three different sections that have also undergone severe upward modifications in recent years.
What is the impact of VAT on our pockets? To determine this, we must first have to know the average household expenditure, which is reflected in the Survey of Family Budgets (EPF in Spanish) of the Statistics Institute. It amounts to 21,233.10 euros for the section of 16-29 years, 26,269.28 euros for 30-44 years, 31,000.40 euros for 45-64 years, and 23,473.38 euros for those over 65. The age group is determined by the supportive household member —that is, the person with the highest salary.
According to the data of the EPF and the calculations of Kenn Garry Chua and Josep Pijoan-Mas, 43.9 percent of that expense supports the general rate of 21 percent, while 33.6 percent carries a tax of 10 percent; 13.6 percent, that of 4 percent; and the remaining 8.9 percent corresponds to expenses that are not subject to VAT collection.
Table 10. VAT spending of households
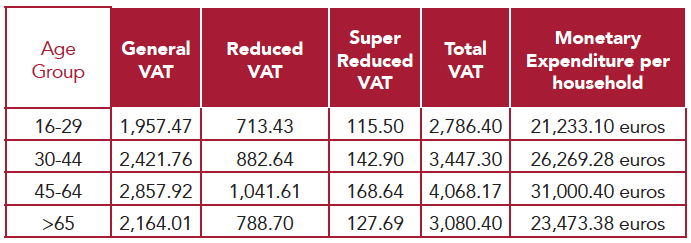
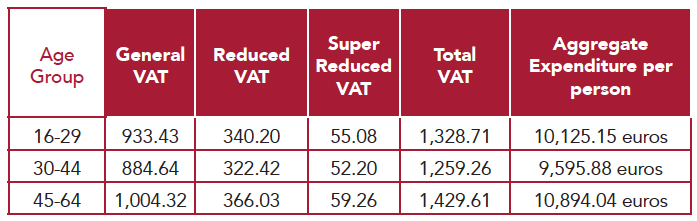
Table 11. Average expenditure on final consumption per person
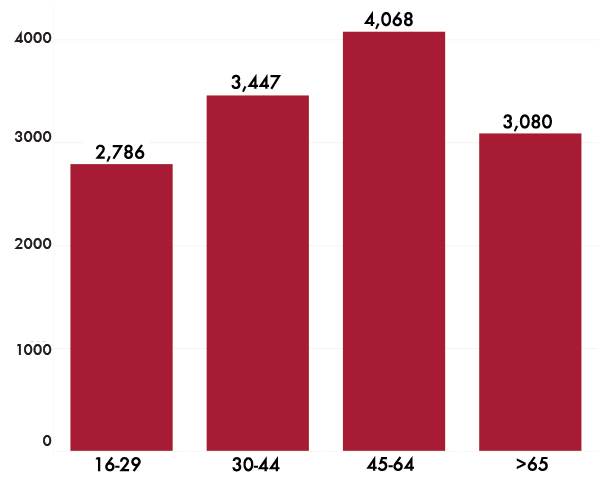
The effective tax pressure linked to VAT moves above 13 percent in all age groups, without major modifications even if income differences are taken into account. This is due to the fact that VAT is a tax in which progressiveness is not observed according to income level, as there are no exempt minimums or differentiated rates. For this reason, VAT is always referred to as the regressive tax par excellence. Your payment translates into an annual outlay of between 2,786 and 4,068 euros, according to the different types of households analysed.
Graph 15. Annual VAT payment per household, according to age groups (in euros)
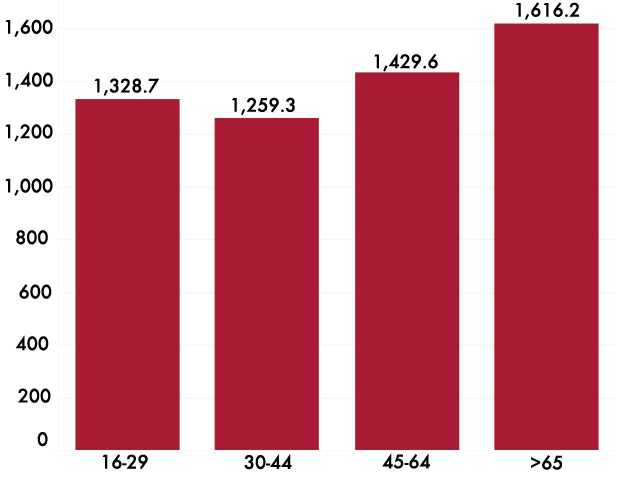
If we look at VAT per person, instead of per household, we find that the cohort between 16 and 29 years of age dedicates to this tax more than that of 30 to 44 years (1,328.71 versus 1,259.26 euros). For cohorts between 45 and 64 years, we talk about an annual payment of 1,429.61 euros. Among those over 65, this tax amounts to 1,616.17 euros per year.
Graph 16. Annual VAT payment per person, according to age groups (in euros)
8. TAX FREEDOM DAY
From all of the above, calculating the Tax Freedom Day consists in expressing the total amount of taxes that a taxpayer pays in Spain, translated into the number of days one needs to work to generate a sufficient income with which to face all his tax obligations, a study carried out annually by Civismo. This calculation includes those already detailed for personal income tax, social contributions and VAT. In addition, the average impact of state, regional and municipal taxes, such as IBI, Property Tax, Inheritance, ITP and AJD, Registration, etc. is considered. The Special Taxes assume a charge that is computed as homogeneous, of 1,026.29 euros per person and year, according to the latest tax collection data at the end of 2018.
In 2019, Tax Freedom Day arrives on June 27; four days before the deadline for submitting the Income Tax Return for taxpayers who do not make direct debit and whose balance was “to be returned”. The date, therefore, does not vary from that of the previous year.
Table 12. Tax Freedom Day in Spain
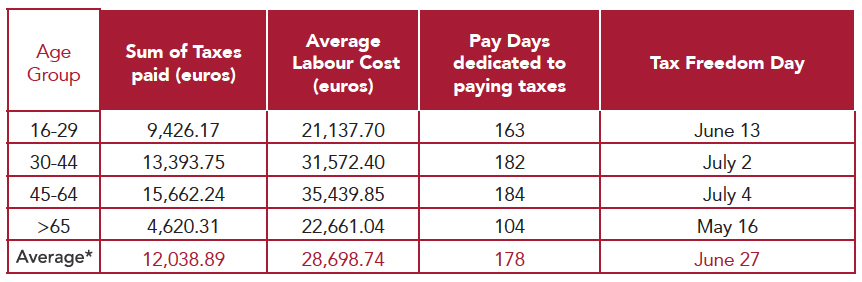
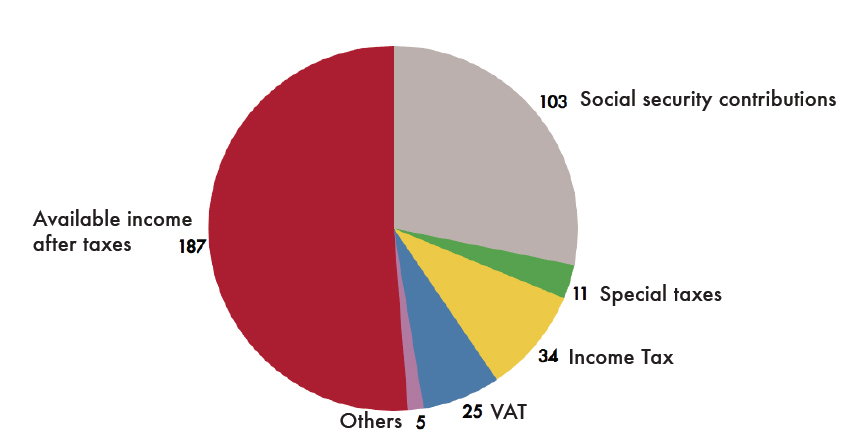
Thus, the average taxpayer dedicates 178 days of salary to pay taxes, with the following distribution: 103 days destined to social security contributions; 34 days to comply with personal income tax; 25 days to pay VAT; 11 days for Special Taxes; and 5 days to other taxes (IBI, Property Tax, etc.).
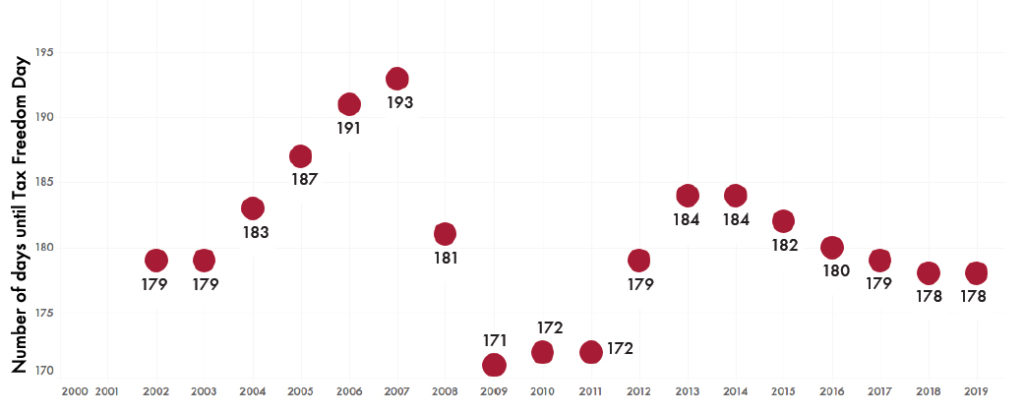
Although, in 2019, the number of days remains unchanged compared to 2018, it presents a change in composition. The measures adopted in the matter of social contributions have increased by one the days necessary to pay taxes (from 102 to 103), while those taken in terms of personal income tax, both by the Central Administration and by the autonomous communities, have subtracted one day in the salary destined to settle accounts with the Treasury: 34 compared to 35 the previous year. In this way, the increase in the minimum contribution bases has been compensated by the increase in the reductions based on the lower income (where a very important part of the taxpayers are concentrated in personal income tax), and by the tax cuts taken conducted by the autonomous communities. The trend that has been observed since 2015 of lower direct taxes continues.
Graph 17. Weight of taxes on the Tax Freedom Day (in days)
Graph 18. Evolution of the Tax Freedom Day 2002-2019
As noted earlier, in 2019 changes in contributions and personal income tax affect the internal composition of the tax payment, but does not translate into a global increase in the number of days of salary. Regardless of minor changes, the only relevant variations for real effective tax purposes [4] are the tax reductions approved on the regional section of the income tax that existed in 2018 [5] in the Canary Islands, (half-point reduction in the first two tranches), Madrid (reduction of half a point of the minimum rate, retroactive to 2018) and Murcia (slight generalised descent of all sections).
As noted earlier, in 2019 changes in contributions and personal income tax affect the internal composition of the tax payment, but does not translate into a global increase in the number of days of salary. Regardless of minor changes, the only relevant variations for real effective tax purposes [4] are the tax reductions approved on the regional section of the income tax that existed in 2018 [5] in the Canary Islands, (half-point reduction in the first two tranches), Madrid (reduction of half a point of the minimum rate, retroactive to 2018) and Murcia (slight generalised descent of all sections).
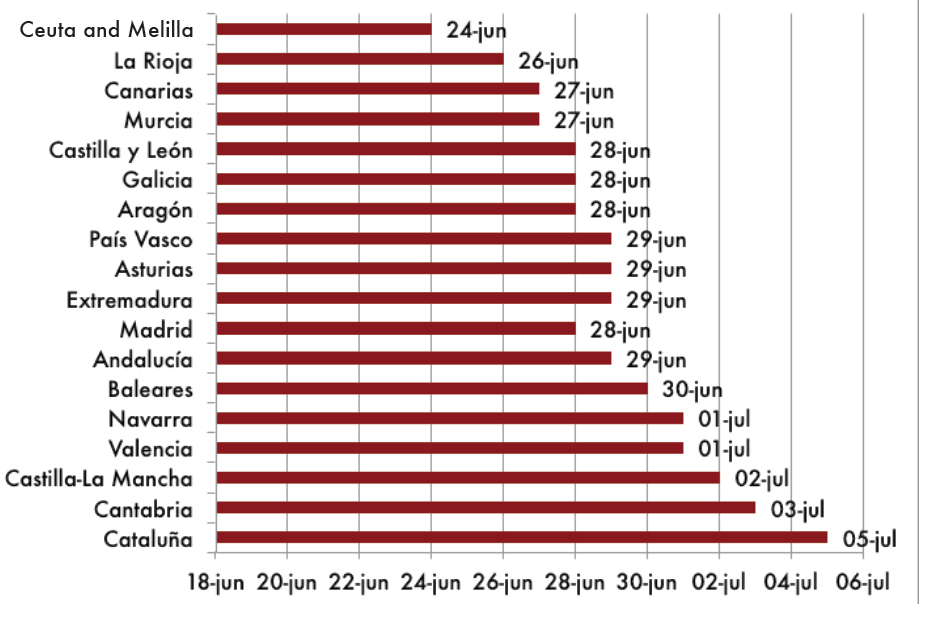
The tax freedom day comes as follows to the different Autonomous Communities:
Graph 19. Tax Freedom Day by Autonomous Communities in 2019 (taxpayer without children)
10. HOW MUCH DO WE GET FROM THE STATE?
The analysis of taxation and its influence on families would not be complete if the public expenditure variable is not introduced, that is, if the taxes paid and how much is received from the State in the form of public services are not compared.
In this regard, the analysis is based on the methodology developed by Levell, Roantree and Shaw (IFS, 2015) [6], in which they evaluate the tax payment of a taxpayer throughout his life and the benefits from the welfare state, also during its life cycle, in the United Kingdom. The authors conclude that only 7 percent of individuals receive more from the State than what they pay, while, if the comparison is made between individuals of the same population cohort, the percentage of net beneficiaries of public benefits rises to 36 percent.
This being a work focused, first and foremost, towards the study of the distribution of income temporarily, the authors offer several interesting clues, which are applied in the next paragraphs to the case of Spain. They clearly observe how only 22 percent of «poor» individuals remain as such throughout their lives, while the percentage of «rich» who are always «rich» amounts to 35 percent. In this sense, they confirm that the redistribution of income through the tax system is not effective throughout the life cycle: it can only be so at specific times, since income transfers occur mostly between the same people but with different ages and at different points in time.
In other words, taxes paid by some today are offset by the social benefits that they themselves will receive later. Specifically, the most important income transfer in the form of taxes paid today to finance the social benefits that individuals will later receive is retirement or public pension. Therefore, the pension system is limited to moving resources from the present to the future, but with different results depending on the characteristics of the individual.
Consequently, following the empirical methodology of Levell, Roantree and Shaw, the evaluation of the extent to which public spending is “profitable” or not for a Spanish taxpayer will be done in two parts: on the one hand, by examining the distribution and the main features of public spending in Spain and, on the other, calculating the distribution of taxes and expenses by population cohorts, evaluating which taxpayers receive more or less social gains with respect to what they contribute, and the parameters that define the balance between contributions and benefits.
10.1. THE COMPOSITION OF PUBLIC SPENDING IN SPAIN: HOW MUCH DOES EACH SPANIARD RECEIVE IN TOTAL TERMS?
With the 2018 General State Budgets extended, economic growth and stability in the public debt markets are serving as a breeding ground for a general increase in public spending. Even the need to balance the accounts and to reach the deficit targets agreed with the European Commission does not prevent the regional governments, and also the Central State itself, from implementing spending plans for the coming years.
With the latest data reviewed by the European Statistics Office (Eurostat), corresponding to 2016, and following its methodology of functional expenditure, Spain dedicates, for every 100 euros of internal wealth (GDP), 42.2 euros to public expenditure each year, which amounts to around 472,000 million euros annually to sustain a structure composed mainly of the welfare state system (about 315,000 million, or 28.1 percent of GDP), the basic administrative expenses (rule of law, etc.) of a State (8.6 percent of GDP), ordinary expenses of Public Administrations (6.1 percent of GDP) and other disbursements (8 percent of GDP).
Since the beginning of the economic crisis in 2008, the Spanish public sector has increased its expenditure by more than 12,644 million euros, without taking into account all the public aid granted for the rescue of Savings Banks in 2012, which were finally computed as an expense (and therefore as debt) within the public deficit. This increase was even greater until 2012, when, for the first time, the ratio of public spending on GDP reached 48 percent again, a level that was not reached in decades, and very close to the 50 percent barrier, which characterizes to an economy where the public sector has more weight than the private one.
However, as of 2012, the scenario has been dominated by budget adjustment plans, with the aim of reducing the excessive deficits of most of the Eurozone countries, among which Spain is. Thus, the application of strong public spending expansion programs (such as Zapatero’s “Plan E”) and the escalation of unemployment have led, on the one hand, to strong cuts in chapters such as grants and cultural promotion, investment in civil infrastructure, or conservation of historical heritage and the environment and, on the other, to strong increases in items such as the interest on debt, social protection programmes or public pension expenditures.
Not only does the recent economic crisis have an impact here. The structure of public spending in Spain is also very peculiar, given the strong decentralisation of the Administration and the distribution of decision-making power. In addition, the weight in our country of the Welfare State (the sum of expenditure on healthcare, education, pensions and social assistance) is one of the highest of the largest economies of the Eurozone. In this sense, the capillarity of public spending is greater than in more centralised States and, at the same time, its control is more difficult when applying policies to reduce the public deficit.
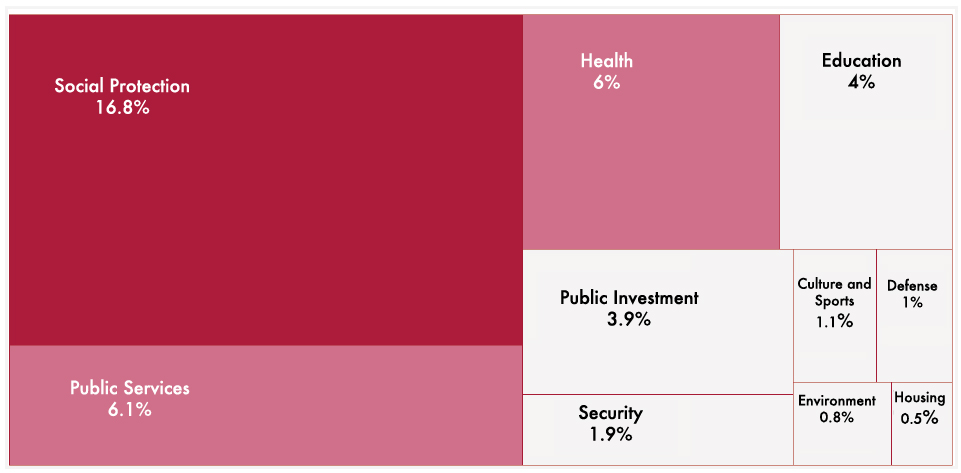
1. Social protection (16.8 percent of GDP)
This is the most important expenditure of the Spanish public sector, with a huge difference from the rest. It consists of pensions (around 120,000 million euros), unemployment benefits (around 20,000 million) and the rest is divided between social assistance and other support costs for low income and non-contributory coverage. It is also the one that has the most rise potential in the coming years, due to the phenomenon of ageing and longevity, which is already increasing the cost of pensions by more than 3 percent per year.
The other main component —social insurance of unemployment— is being reduced in an accelerated way thanks to the creation of work and, consequently, the decrease in unemployment which, since the third quarter of 2013, is being verified at a good pace. This, which represents one of the most important automatic stabilisers (expenses that grow in periods of crisis), returned to pre-crisis levels in 2018.
2. Ordinary expenses (6.1 percent of GDP)
This category includes the basic maintenance of the Public Administration, based essentially on the salaries of public employees, the ordinary cost of Public Organisations, the legislative and executive branches (national and regional parliaments and governments, respectively) or the representation of Spain abroad through embassies, consulates, permanent representations and other diplomatic initiatives.
In this case, more than the effect of the crisis, the item expands as the payroll of the Administration and its budgets grow, parallel to the Eurozone average.
3. Healthcare (6 percent of GDP)
Healthcare spending increases slowly, but in relation to the needs of a population whose average age increases by three years per decade, according to the latest UN Population Outlook Report. It also evolves according to the demand for attention to diseases in a context of greater diagnosis and of an ageing population, with the consequent appearance of degenerative pathologies, whose costs are increasing.
4. Education (4 percent of GDP)
Education spending has remained virtually unchanged in terms of GDP, above 40,000 million euros over the years of crisis until 2016. However, the budget policy of the autonomous communities has given priority to other items, increasing the debt, for example, of public universities, or freezing the provision of new technological infrastructures to schools.
5. Investments (3.9 percent of GDP)
Spain has gone from being the country that spent the most on infrastructure to being the one that did the least. The public investment item is the one that has suffered cuts the most in recent years. Thus, in 2016, it was 16,221 million euros lower than that of 2008. In the same way, other capital transfers have been carried out, such as subsidies for agriculture, livestock and fisheries, whose support depends entirely on the Common Agricultural Policy (CAP).
6. Security (1.9 percent of GDP)
This item includes the maintenance of the basic institutional infrastructures of Spain: internal security (Police, Civil Guard, and regional and local police), the prison system, and the judiciary. In this case, Spain is one of the countries with the most resources to maintain public order among its European partners. In fact, the allocation has practically not changed despite the economic crisis.
7. Subsidies and Culture (1.1 percent of GDP)
This is the most punished chapter, with a cumulative reduction of 7,000 million euros from its record high in 2010. It includes the money that the various Public Administrations devote to cultural promotion, direct or indirect financing of religious denominations, film subsidies and the cost of publicly owned media networks.
8. Defence (1 percent of GDP)
The budget of a basic institutional infrastructure facing foreign countries, the military amounts to 11,000 million euros; that is, the third lowest expense in Spain. However, it is one of the items most likely to increase in the coming years, given NATO’s demand to allocate 2% of annual GDP in defence.
9. Environment (0.8 percent of GDP)
This section is one of the most extensive and heterogeneous, since it includes actions such as the conservation of forest heritage (publicly owned), maintenance of natural parks (whether national, regional or local parks), collection, processing and management of waste (competition that, at this time, have provincial councils and councils of mayors), or investment in pollution reduction and rural infrastructure, among others. Although it barely reaches 1 percent, the variation in the years of crisis has not been significant.
10. Housing infrastructure (0.5 percent of GDP)
The last of the ranking is the expenditure on housing for official protection, in urban planning of municipalities, street lighting, water connections, asphalting of streets, and other municipal competition. The burst of the real estate bubble and the severe restrictions imposed by the Treasury on municipal budgets have halved their resources.
Graph 20. Distribution of public spending in Spain (2016)
This is the level of the main public expenditure items in Spain. However, do not confuse spending with doing so effectively, or more so efficiently. That Spain spends less on GDP than other European countries does not mean that it achieves more effectively the objectives set.
Comparing in terms of GDP has the advantage of offering a simple measure, but it can be misleading. The productive structure of Spain is very different from that of its community partners and, precisely, the current one reflects better the preferences of Spanish citizens, who prefer to have universal healthcare and a public pension system rather than dedicating more money to culture, subsidies, defense or even increase budget in public education.
10.2 THE BALANCE BETWEEN CONTRIBUTION AND PERFORMANCE. WHO BENEFITS THE MOST FROM THE STATE?
Once the photograph of public spending in Spain is seen, the economic value of the services received by each citizen is determined based on the age cohort in which one is located. It is calculated taking into consideration the distribution of the population of Spain, with data from the latest Census available [7], and the demand for, for example, health and education, based on the Family Budget Survey.
Graph 21. Public expenditure received by individual by population cohorts (in current euros)
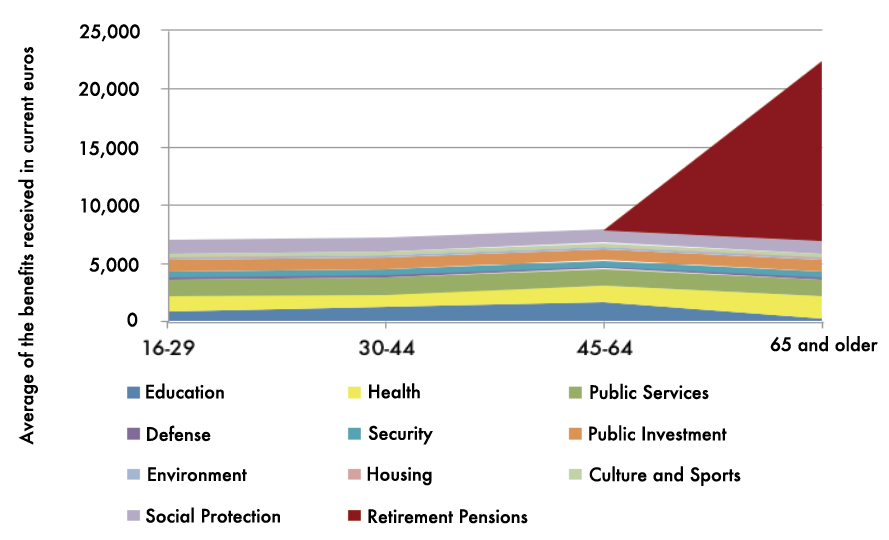
As can be seen in the graph, the main benefit that a taxpayer receives is the public pension at the time of retirement (15,454 euros per year at current prices), followed by healthcare expenditure (1,919.68 euros). In the cohort where the average age of the population is located (between 45 and 64 years), the three most important social benefits are education (1,624.25 euros per year), followed by public services (1,461.84 euros per year) and healthcare (1,451.47 euros per year). Right behind are social protection (unemployment benefit, income supplements and family aid, amounting to 1,134.59 euros per year) or public investment (946.66 euros), among others.
In the youngest cohorts, the most relevant expenses are those related to the operation of public services, followed by healthcare and social protection. Therefore, as the age progresses, the reception of benefits grows, until it increases exponentially with the arrival of retirement. Specifically, the economic value of what a person receives is more than tripled, from 6,934.42 euros nominal between 16 and 29 years, up to 22,388.80 euros from 65 onwards.
As for taxes paid, according to the calculations of the previous sections, the distribution is as follows:
Graph 22. Taxes paid by individual and population cohort (in current euros)
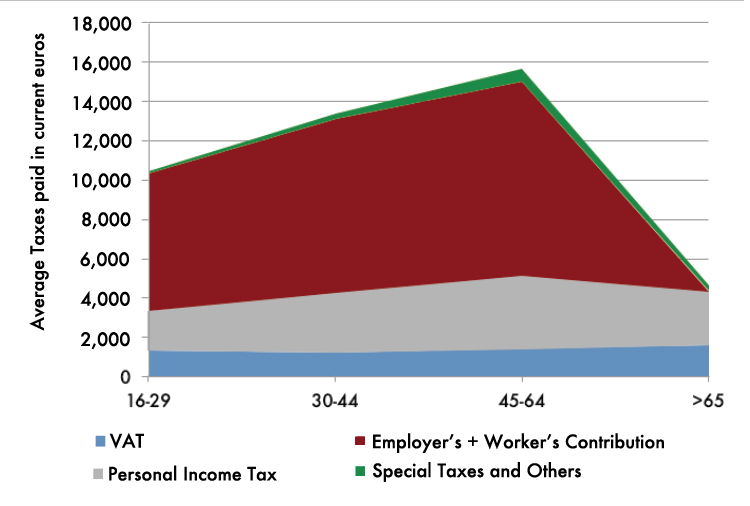
The highest payment of taxes (15,662.24 euros) occurs in the mature working age of the individual, which bears a charge for social contributions that is equivalent to two thirds of the total taxes paid. This “peak” is given, above all, by personal income tax, special taxes, and regional and municipal taxes. As the retirement age approaches, the payment of taxes falls drastically, to stand, for the type of individual used in this study, at 4,620.31 euros. The only tax that increases its nominal pressure on retirees is VAT, since demand shifts from investment goods (not subject to VAT) to consumer goods (which are taxed with it, mainly, at the reduced rate of 10 percent; and in general, 21 percent).
Finally, the summary of total taxes paid and benefits received is as follows:
Graph 23. Taxes paid and public spending received (in current euros)
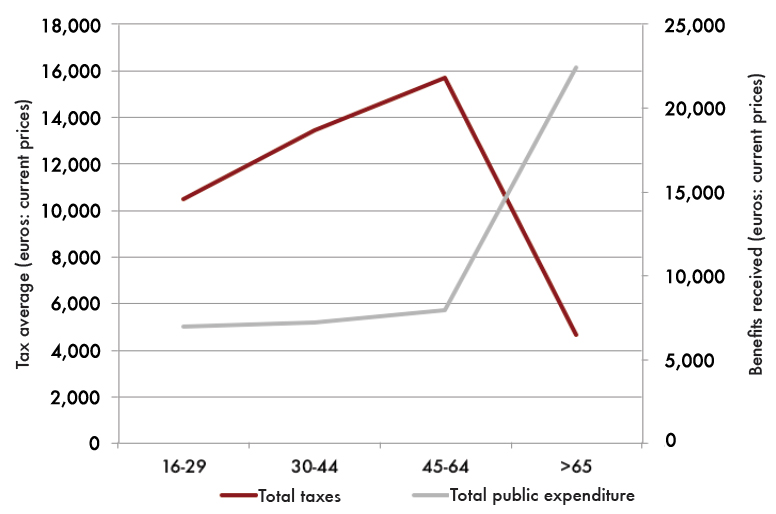
Therefore, in light of the empirical evidence for Spain, less than a fifth of taxpayers receive more than they have contributed to the State, while practically 80 percent of them pay more than what they received, at least until the retirement age. Thus, the factor that changes the direction of the balance is the action of the public pension system. This explains 70 percent of the difference between taxes paid and benefits received for the working age population.
In other words: workers, both directly and indirectly (the social security contribution paid by the employer), agree to pay for 35 years (standard social security contribution) between 3,515.33 euros (at an early working age) and 7,775.23 euros annually (in adulthood) above the amount received in public services, to receive a net benefit in the form of a pension, health and dependency in the amount of 17,768.49 euros per year for 20 years.
Ultimately, workers are redistributing their income over time, sacrificing income in the present to be able to enjoy them in the future, in exchange for an implicit return in terms of security or confidence that the State will always pay said pension. However, this temporary transfer of resources is subject to various uncertainties that the citizen cannot control:
a) Increases in the rates and contribution bases.
b) Changes in the future of the consolidated rights of pensions, due to demographic, labour or political factors —lowering of the replacement rate, sustainability factor, indexation to the CPI, evolution of wages, of the contributors-pensioners relationship, etc.
Therefore, the profitability of paying taxes in Spain will depend, on the one hand, on the current net value of pensions paid when retirement comes at age 65 years —bearing in mind the current life expectancy 85 years on average— and, on the other, of the expected value of contributions from both the employer and the employee until the retirement date.
In a professional career with the social security contribution period, 35 years, with average bases around the median salary per population cohort, as used in this study, and taking the last 25 years to prepare the calculation of the pension, it is difficult to recover in the two decades after retirement everything that was previously paid, both by employer and by the employee. In order to balance contributions and benefits in inter-temporal terms in an amount around 300.00 euros at 65 years of age, a pension revaluation index of 1 percent should be used, which is certainly far from reality, given the inflation rate of the history average.
However, current retirees who have had lower contributions do enjoy a certainly generous public pension, and that returns to them much more than what they contributed. For example, to a retiree who contributed the highest base of his entire career during the last 15 years of his working life, the public distribution system will have paid 158,237.92 euros; everything that was contributed (both by him and by the company) at current value at 11 years of being retired, that is, when he turns 76 [8]. The figure he will receive until his death, under an annual revaluation rate of 2 percent, will be multiplied to almost 300,000 euros.
Graph 24. Evolution of the average pension under the pension revaluation index
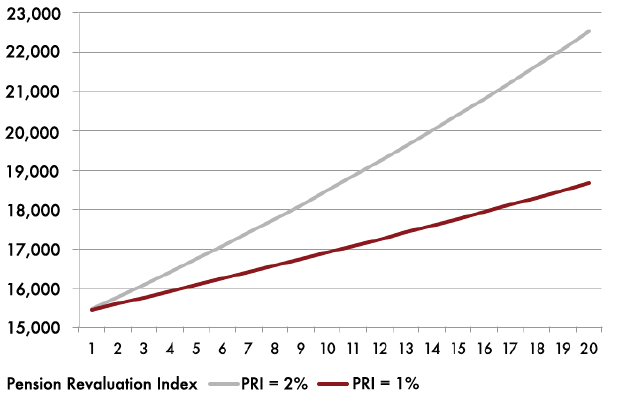
In summary, a person receives more money from the State than he has paid, depending on the amount of the public pension he receives in the future and the evolution of the social security contributions paid during his working life. Excluding the Social Security system, the payment of taxes is not profitable for more than 80 percent of taxpayers of working age.
With the measures adopted in the General State Budgets for 2018 and Royal Decree 28/2018, which broke with the reformist dynamics when returning to indexing with the CPI (1.7 percent annual revaluation), we are closer to the stage which draws an pension revaluation index of 2 percent. This triggers the profitability of having paid contributions for current retirees, and puts today’s contributors in a compromised situation, given a foreseeable lack of resources in the future. It will be necessary to rely on a moderation of inflation before the end of 2018 in order to avoid a greater embezzlement in public accounts, both today and tomorrow.
10. CONCLUSIONS
This study shows an empirical balance of the taxes that a family pays in Spain and what it obtains in exchange for its contribution to the State. As phenomena such as longevity advance [9], the net benefits of the public system decrease, while the cost in terms of taxation increases.
Such taxation is far from being limited to “public” resources for defence and to run the State, as well as other goods which are not provided by the market —or that are inefficient, because of, for instance, monopolies. Quite the contrary, the huge amount of resources transferred from individuals to the Treasury —unequivocally coercively— gives the State unprecedented power, and considerably limits individual freedom.
Apart from the taxes that we have broken down here, and once their real weight on family income has been calculated, other types of burdens that, although not formulated as taxes, also weigh on the taxpayer, also deserve special attention. They are authentic «taxes in the shadow», since they are masked, but they do not cease to have a very burdensome impact in the medium and long term. We talk about inflation and public debt.
THE “TRICK” OF NOT DEFLECTING THE INCOME TAX RATES
One of the basic tax principles is the ability to pay, according to which, the taxpayer pays taxes based on his ability to generate income. However, this capacity may be altered by the phenomenon of inflation.
Graph 25. Evolution of the GDP Deflator (year-on-year variation rate), at market prices and corrected for seasonality and calendar
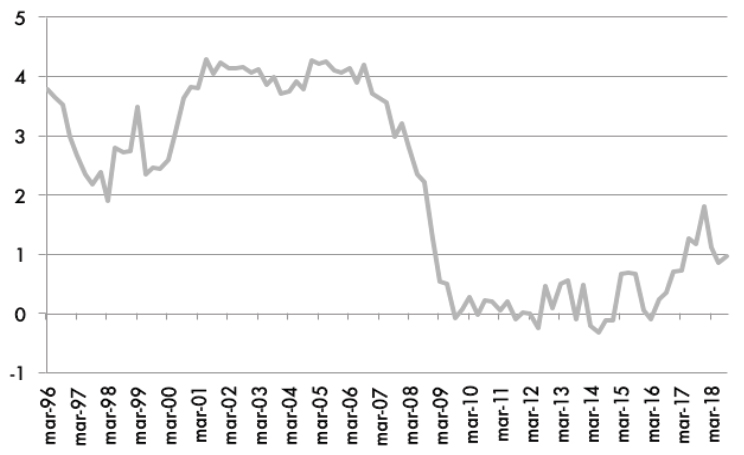
To correct this effect, the Consolidated Text of the Law on the Personal Income Tax contemplates the deflation of personal income tax rates. Despite this legal mandate, the Tax Authority has not applied these corrections since 2008, except in the case of the Treasury Offices of Navarra and the Basque Country. Inflation is still a “shadow” tax that also affects taxpayers asymmetrically and regressively. Younger age groups suffer more significantly, but it affects all generations.
If we relate the deflated tax base with the rates that have been applied, we see that the effort in the personal income tax is “inflated” 4.73 percent since 2008. And it is that, despite the fact that prices fell slightly in the years 2013 and 2014, accumulated inflation since the outbreak of the crisis has reduced the purchasing power of Spaniards by 4.73 percent.
For an average salary (a representative worker in a family and with a child older than 6 years at the midpoint of maturity of his professional career), not deflating the income tax rates is translated into five more days of gross salary delivered to the Treasury. In monetary terms, it implies an additional payment of 430 euros. Therefore, the Tax Freedom Day would have arrived on June 23 and not on June 27 if the personal income tax had been updated according to the price increase observed during the crisis.
THE INCREASE OF THE PUBLIC DEBT, THE TAXES OF THE FUTURE?
Under certain conditions, a fundamental conclusion of economic theory is that it is indifferent to finance public spending with taxes or with public debt, since issuing obligations is nothing more than transferring the payment of taxes into the future. This thesis, known as that of the «Ricardian Equivalence», points out that, in fact, the Treasury is continually in the position of advancing income from the future to the present each time it incurs a debt process following the public deficit.
Public debt has been increasing year after year since the crisis broke out, due to the lack of budgetary stability and the continued use of the deficit. This is a significant burden for present and future generations.
Graph 26. Evolution of Public Debt in nominal terms
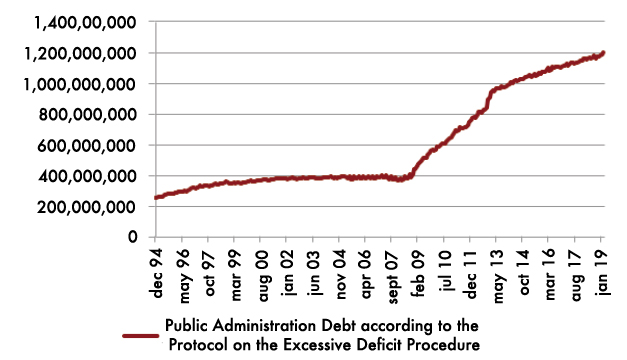
How much does this “shadow tax” mean? On days of gross salary, we talk about 101 days more pay that would go to meet the treasury. This would delay the Tax Freedom Day from June 27 to October 6. That is, 280 pay days dedicated to paying the Treasury. Consequently, we can say that the debt “covers” the real weight of the taxes, delaying in time a payment equivalent to more than three months of salary.
In monetary terms, the tax effort of the Spanish taxpayer, once we consider the public debt, rises by 7,961.50 euros. This figure has been growing as the total state liability has done. With the data of March 2019 published by the Bank of Spain, the burden of public debt for the taxpayer is progressing at a rate of 3.22 percent year-on-year, less than one percent below the nominal GDP increase rate. This continues to indicate a reduction in the debt burden in real terms, but less and less due to the decline in the growth rates of Spain’s GDP.
However, and although the public indebtedness that Spain has assumed falls on all taxpayers, employees assume the bulk of this slab, as they bear all the collection by personal income tax and social security contributions, to which some other direct or indirect burdens could be added.
The public debt is close to the threshold of 100 percent of GDP (1.2 billion euros, as of March 2019), which would be equivalent to a burden of 61,618 euros for each worker (19.47 million of people, according to the Active Population Survey of the First Quarter of 2019).
As noted above, the two «shadow taxes», debt and inflation, especially hurt younger generations. This, together with the current pension system and the tax structure, make the intergenerational gap widen more than ever, putting the sustainability of the system and the State basic agreements between the different political formations in trouble.
Therefore, in addition to reforms that boost the competitiveness and productivity of the Spanish economy, it is necessary to articulate complementary mechanisms that alleviate the tax burden during working life, and avoid, otherwise, irreversible loss of value of public services. In this sense, the comparison between taxes paid and profits received will improve if sufficient resources are obtained through non-tax ways, which do not impair the growth capacity of the Spanish economy.
11. REFERENCES
• Overview of Autonomous and Regional Taxation 2019, Registry of Fiscal Advisory Economists (REAF), 2019.
• Redistribution from a Lifetime Perspective, Institute for Fiscal Studies (Levell, P., Roantree, B., and Shaw, J), 2015.
• Solutions for Retirement, International Financial Analysts and UNESPA (Iratxe and Herce), 2018.
• Longevity and changes in savings and investment, Fundación de Estudios Financieros (Javier Santacruz), 2017.
[1] Methodology based on studies such as the Institute of Fiscal Studies of the United Kingdom and another bibliography that has quantified the impact of public spending, both in the short term and in the long term, compared to how much a taxpayer pays.
[2] The latest available data are those corresponding to 2016, published in 2018, in the INE Salary Structure Survey. To see the origin of the data, here: https://www.ine.es/dyngs/INEbase/es/operacion.htm?c=Estadistica_C&cid=1254736177025&menu=resultados&idp=1254735976596.
[3] The contribution bases are computed in 12 payments.
[4] The Balearic Islands, the Canary Islands or Galicia, among others, have established new deductions in the autonomous quota. These modifications do not translate into appreciable reductions in salary time to devote to paying taxes.
[5] A useful and essential guide every year to monitor the tax developments in the main taxes partially or totally assigned to the autonomies is the REAF report called “Panorama of the Autonomous and Regional Taxation 2019”.
[6] Levell, P., Roantree, B., y Shaw, J. (2015). “Redistribution from a Lifetime Perspective”, IFS Working Paper W15/27, Institute for Fiscal Studies, UK, September 2015, pp 19-24.
[7] La distribución de la población en 2017 por cohortes es la siguiente (Fuente: INE):
| Less than 30 years | 30.15% |
| 30-44 | 23.06% |
| 45-64 | 27.97% |
| More than 65 years | 18.82% |
[8] These own calculations are close to others made in the most recent literature on Social Security and the public pension system. For more information, read Iratxe and Herce (2018). http://www.afi.es/webAfi/descargas/1731979/1252800/Soluciones-para-la-jubilacion-Informe-de-Afi-y-Unespa.pdf
[9] J. Santacruz Cano (2017): “Longevity and Changes in Savings and Investment”, Investment Issues Forum Document No. 2, Foundation for Financial Studies.